Note DERIVE demo version (30-day free trial) at
http://education.ti.com/product/software/derive/down/download.html
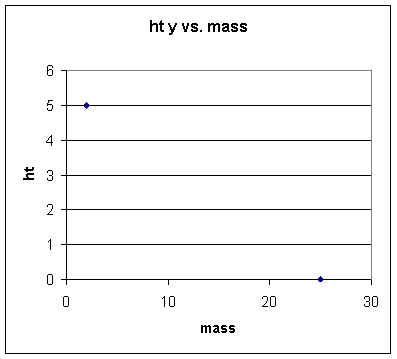
Spring ht vs. mass:
| mass | ht y |
2 |
5 |
25 |
0 |
Linear function. Easily graph the two points:
Slope from (2,5) to (25,0) is `dy / `dx = -5 / 23 = -.22 approx.
It turns out that the straight line between points is height = -.217 * mass + 5.44, approx.
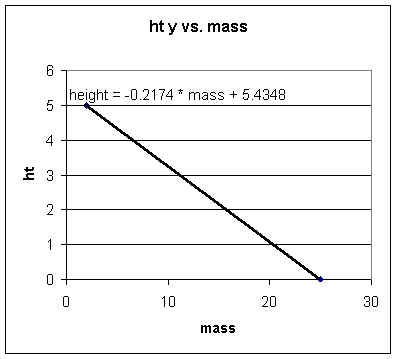
We'll see shortly how to get the equation.
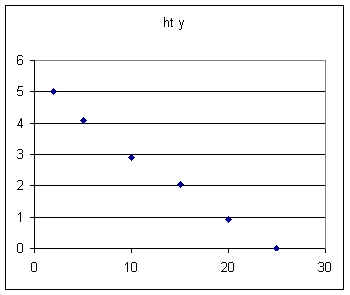
A series of observations might give us a table and a graph something like
mass |
ht y |
2 |
5 |
5 |
4.1 |
10 |
2.9 |
15 |
2.05 |
20 |
0.93 |
25 |
0 |
The 'best-fit' straight line for this data is a little different than for the 2-point data:
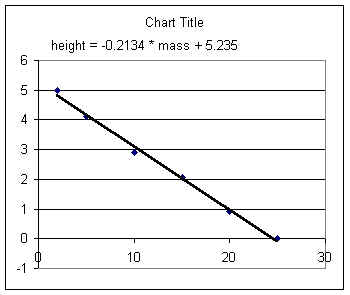
Note that the 'best-fit' line doesn't go through any of the points. For real-world data this is usually the case. The line comes as close as possible, on the average, to all the points.
Back to the original 2-point graph: How do we get the equation of a line through two points?
Substitute coordinates of the two points into the form y = mx + b to get
If we subtract 2d eqn from first we have
which gives us
This is the same as the slope we got before. Note that we coulda just substituted this slope into y = mx + b to get y = -.217 + b, then just substituted the coordinates of one point.
Now substitute m = -.217 into the first of the two equations to get
and solve for b to get
Thus our equatoin is
meaning
The data set
mass |
ht y |
2 |
5 |
5 |
4.1 |
10 |
2.9 |
15 |
2.05 |
20 |
0.93 |
25 |
0 |
gave us the best-fit line
To judge quality of fit we find the predicted height for each of the observed masses:
mass |
ht y |
pred ht |
deviation |
2 |
5 |
4.8082 |
-0.1918 |
5 |
4.1 |
4.168 |
0.068 |
10 |
2.9 |
3.101 |
0.201 |
15 |
2.05 |
2.034 |
-0.016 |
20 |
0.93 |
0.967 |
0.037 |
25 |
0 |
-0.1 |
-0.1 |
Standard deviation is square root of average of squared deviations:
squared deviations are -.1918^2 = .04 approx, .068^2 = .0046 approx., etc.
We average these squares then take the square root to get std dev.
If we have 12.4 kg of water what is ht?
Cups to bring end to ground: