Precalculus II
Class Notes, 1/11/99
These notes are related to the Team Exercise shown at the end of
this document.
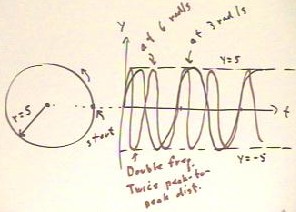
The figure below depicts the graphs of the vertical coordinate of a
circle vs. clock time t, corresponding to motion around a circle at 6
radians/second and at 3 radians/second.
- At 3 radians/second we obtain the graph depicted in black,
while at double this speed, or 6 radians/second, the
point goes through its cycles twice as fast and corresponds to the red
graph.
- As the frequency doubles from 3 radians/second to 6
radians/second, the distance between peaks becomes half
as great.
- If the circle has radius 5, then the highest point on
either graph will be at y = 5, and lowest point at y
= -5.

We use the following terminology:
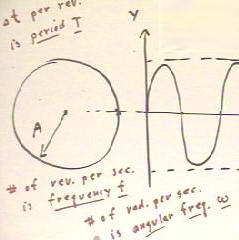
- The time required for a complete cycle around the
circle is called the period of the cycle and is a designated by T.
- The number of cycles per unit time, usually but not always in cycles/second,
is called the frequency of the cycle, designated by f.
- The angular displacement per unit time, usually but not always in radians/second,
is called the angular frequency of the cycle and is designated by the
Greek letter `omega.
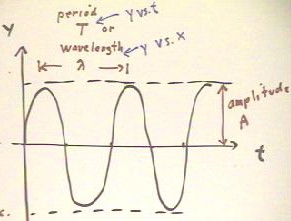
- The distance from the t axis to a point at maximum distance from
the axis is called the amplitude, designated by A. The amplitude
coincides with the radius of the circle.

The peak-to-peak distance on the graph of y vs. clock
time t is called the period T of the cycle.
On a graph of displacement y vs. position x, we will
call the peak-to-peak distance the wavelength of the cycle, designated by
the Greek letter `lambda..

First sketch a graph of y coordinate vs. clock time:
- While watching the circular model simulation, with
angular velocity `omega = 3 rad / sec, move your pencil on
your paper along with the y coordinate of the point moving around the
circle.
- Repeat the exercise while your partner moves the paper to
your left across the table, at a constant velocity of 1 cm / sec.
If you don't have a partner, predict what the graph will look like.
- Then sketch the graph by yourself as you move
your pencil across the paper (to the right) at 1 cm / sec while
moving it up and down to coincide with the y coordinate on
the simulation.
- Label the t axis in seconds.
Investigate the effect of the angular velocity of the
point moving around the circle on the curve you sketch:
- Change the angular velocity to 6 rad/sec and repeat the
preceding exercise.
- What happens to the distance between the peaks of your graph when you double
the angular velocity?
- Predict what your graph will look like if you increase the angular
velocity to 9 radians/second. What will be the distance between
the peaks?
- Using the same procedures as before, change the angular velocity to 9
radians/second and sketch your graph while watching the
simulation.
- Predict what your graph will look like if you decrease the
angular velocity to 1 radian / second. What will be the distance between
the peaks?
- Using the same procedures as before, change the angular velocity to 1
radian/second and sketch your graph while watching the
simulation.
- Summarize how the distance between the peaks of your
graph is related to the angular velocity of the simulation.
Consider the effect of changing the radius of the
circle.
- Using an angular velocity of 3 rad / sec, sketch the
graph of the y coordinate, moving your pencil horizontally 1 cm every second, as the radius
of the circle is decreased by striking the 'S' key once
every 2 seconds.
- How might this graph represent the motion of a pendulum under certain
circumstances? What might be the circumstances?
Investigate the effect of the starting point on the graph:
- Move your pencil up and down along the y axis of a graph, in
conjunction with the y coordinate of the simulation. Do not yet
begin moving your pencil across the paper.
- After you have established your rhythm, wait for the instant at which the point on the
circle reaches its highest point. At this instant have your partner begin
moving the paper as before (or, if you do not have a partner, begin
moving at 1 cm/sec to the right as you continue your up-and-down
motion).
- Predict how the graph should compare if you were to repeat the
preceding experiment, starting again at the y axis but this time waiting
to begin motion of (or across) the paper for the instant at which the point on the circle
reaches its lowest point.
- Sketch the two graphs as you believe they would be if you were able to
perform the exercise with complete precision.
- How would the graphs compare if you were to repeat the
preceding experiment four times, first starting at the instant the
reference point on the circle reaches its rightmost position, then
starting at the instant this point reaches its highest position, then
starting at the instant the reference point reaches its leftmost position,
then starting at the instant the point reaches its lowest position?
