Precalculus II
Class Notes, 1/21/99
This class is being held on Jan. 21, 1999.
- The afternoon temperature is in the mid-'60s.
- Statistically this is the coldest day of the winter.
- Winter is half over.
- We note that it has also reached -21 Fahrenheit locally on this
date.
The local daily average temperature varies from approximately 35
Fahrenheit on Jan. 21 to 75 Fahrenheit on July
21.
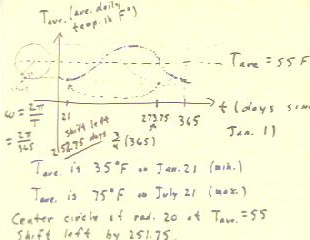
We wish to find a circular model of the annual temperature
fluctuation, based on these values.
- We begin by sketching our coordinate axes, the vertical axis for the average
daily temperature Tave and the horizontal axis for the
clock time t in days since January 1.
- We note that the annual cycle will last 365 days.
- We locate the circle so that its low and high points correspond
to the minimum and maximum average temperatures, 35
Fahrenheit and 75 Fahrenheit.
- The circle will therefore be centered at vertical coordinate Tave
= 55 Fahrenheit, and will have a radius of 20 Fahrenheit.
- The circle is indicated in the figure below.
- The standard sine function, corresponding to a starting point at
the rightmost point of the circle, is sketched very lightly in the
figure.
- We want the low point of the curve to occur on day 21,
corresponding to Jan. 21.
- We must thus shift the graph so that the low point shifts from
its position on the standard sine function to the desired
position.
- On the standard sine function the position of the low point is at 3/4
of the 365 day cycle, or at day 273.75.
- We must therefore shift the graph -252.75 days in the horizontal
direction.
- This shift corresponds to changing the starting point on the circle to
the indicated third-quadrant position.
- The angular frequency of the motion around the circle is `omega
= 2 `pi / 365.

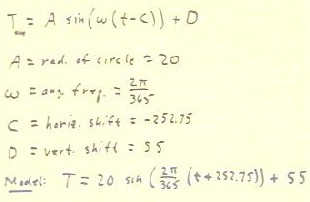
The corresponding model Tave = A sin(`omega * (t - C) ) + D is
obtained by simply filling in the parameters:
- A the is the amplitude of the graph, and corresponds
to the radius of the circle.
- `omega is the angular frequency of motion on the
circle, in radians/second.
- C is the horizontal shift of the graph.
- D is the vertical shift, corresponding to the vertical
position of the center of the circle.
- These parameters have been determined above and are indicated below.
Our final model is indicated in the last line below.

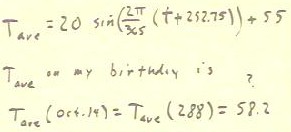
We can use our model to predict the approximate average
daily temperature on any day of the year.
- You should predict the average daily temperature on your
birthday, and be sure that it makes sense for the time of the year.
- My birthday is October 14, which is the 288th day of the year.
- Plugging t = 288 into the function, we seem to obtain Tave
= 58.2, though this value is questionable. Check it out for yourself.

`03
To model to length of the daylight in Fairbanks,
given that the shortest day occurs on December 21, when there are 3.7
hours of daylight, we must determine the values of the parameters A,
`omega, C and D in the model y
= A sin(`omega (t - C) ) + D.
As always, the parameters values are determined by the circular
model:
- A is the amplitude of the graph, equal to the radius of
the circle.
- `omega is the angular frequency, the number of
radians/sec at which the reference point on the circle must move..
- C is the horizontal shift required to move the
'standard' sine curve to the required horizontal position..
- D is the vertical shift, which is the vertical
position of the center of the circle.
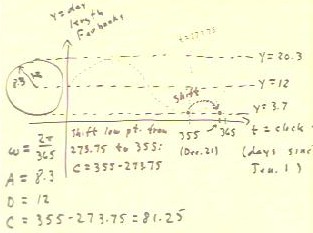
We first position the circle can determine its radius, thereby
obtaining the values of A and D:
- The length of the average day is 12 hours, so the center
of the circle goes at y = 12.
- The length of the shortest day is 3.7 hours, so the lowest
point of the circle is at y = 3.7.
- The radius of the circle is therefore the difference 12 - 3.7 =
8.3.
- From the center and radius we determine that the highest point on the
circle is at 12 + 8.3 = 20.3.
- We conclude that A = 8.7 and D = 12.
We next determine the angular frequency of the motion on the circle:
- Since it requires 365 days to complete a cycle, the angular
frequency is 2 `pi rad / 365 days.
- We therefore conclude that `omega = 2 `pi / 365.
We finally determine the horizontal shift of the graph.
- The low point of the graph of the standard sine function, corresponding
to starting at the rightmost point of the circle, lies 3/4 of the way
from 0 to 365, at t = 3/4 * 365 = 273.75.
- The low point of the day-length graph must lie at day number 355,
corresponding to December 21.
- We therefore must shift the graph 355 - 273.75 = 81.25 days
in the horizontal direction.
- Thus our parameter C is 81.25.

Our model of day length in Fairbanks is therefore y = 8.3
sin(2 `pi / 365 (t - 81.25) ) + 12.

`04
