Day 1 Quiz
1. If you travel 300 miles in 6 hours what is your average speed?
2. How do you figure out average speed from how far and how long it took? Don't quote some formula you remember from high school. You almost certainly didn't use a formula to answer the first question and if you did you almost certainly didn't really need the formula. What is the common sense of this situation?
3. If you travel at 60 miles an hour for 4 hours how far do you go?
4. You generalized question 1 when you answered question 2. How can you generalize question 3?
First Experience with Pendulum
If a pendulum gets longer does it take more or less time to swing through one complete cycle back and forth?
If one pendulum is twice as long as another will it take more than twice as long, less than twice as long or twice as long for it to swing through one complete cycle?
If a sandbag is hanging from a 20-foot rope do you
have to push harder to move it 2 feet from its 'natural, at-rest' position or to
push it 4 feet from this position?
Would the ratio of forces in the preceding question be 2-to-1, more than 2-to-1 or less that 2-to-1?
Pendulum calibration
Give a table showing the number of cycles in 30 seconds vs. the length in cm. of the pendulum.
Give a table showing the number of second required for a single cycle of the pendulum vs. the length in cm. of the pendulum.
When the calibration is complete write down the equation we obtained for the period of the pendulum as a function of it length in cm.
Here are data taken by the class:
| length | period | cycles counted in 60 sec |
| 20 | 0.909091 | 66 |
| 10 | 0.631579 | 95 |
| 6 | 0.550459 | 109 |
| 10 | 0.689655 | 87 |
| 20 | 0.909091 | 66 |
| 16 | 0.789474 | 76 |
| 19 | 0.857143 | 70 |
| 25 | 1 | 60 |
| 20 | 0.869565 | 69 |
| 7 | 0.566038 | 106 |
| 10 | 0.594059 | 101 |
| 22 | 0.9375 | 64 |
| 30 | 1.090909 | 55 |
| 20 | 0.895522 | 67 |
| 22 | 0.923077 | 65 |
| 5 | 0.46875 | 128 |
| 25 | 1 | 60 |
| 20 | 0.923077 | 65 |
| 20 | 0.909091 | 66 |
| 20 | 0.909091 | 66 |
| 30 | 0.75 | 80 |
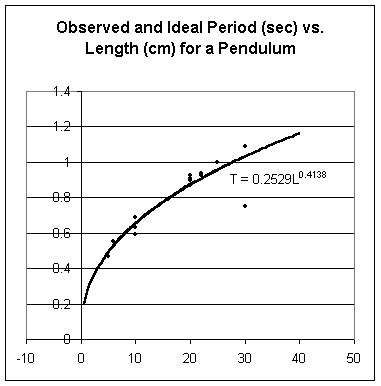
A graph of observed period vs. length gives us the following graph and best-fit power function:

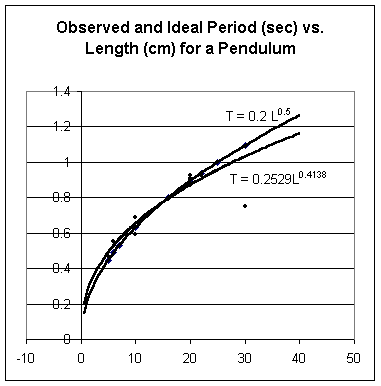
As we will see later in the course the theoretical function is T = .200 * L^.5 (approx). This function is graphed on the same graph as the observed data. We see that except for one clearly anomalous data point the 'ideal' function does a very good job of fitting the observed data. The one anomalous point 'pulls down' the best-fit power function, resulting in the somewhat erroneous model T = .25 L^.41.

For reasons we will see later in the course the ideal function is y = .2 * L^.5
Marble exercise
You have a marble and a ruler. You can see the clock. You
can swing a pendulum, which you can also measure.
Put the marble in a situation designed so that it travels a
certain distance (you select the distance) in the same time interval every time
the situation is repeated. Make
three trials and determine how fast the marble is moving in each trial.
Record the data you use to make your determination.
Was the marble's speed changing or constant during a given
trial? What makes you think so?
Did you measure an actual speed or the average of a
changing speed?
Make the marble do something so it travels the same distance in the same time interval, three different times. Use your pendulum to get the data you will need to determine how long it takes, and use your ruler to get data to figure out how far.
Homework:
Write two paragraphs to answer the following: