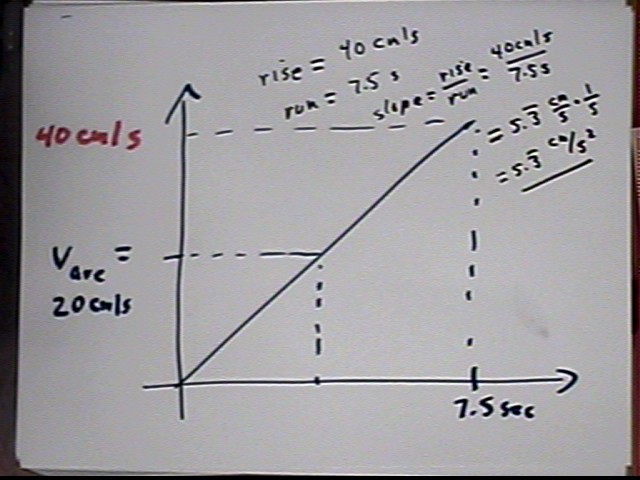
The figure below the v vs. t graph for an object which accelerates uniformly from rest, with an average velocity of 20 cm/sec for a 7.5 sec time interval.
We note the time interval and the average velocity in the appropriate palces on the graph.
Since the graph forms a straight line we conclude that the ave velocity occurs at the midpoint of the time interval and that the final velocity, which occurs at the endpoint of the interval, is therefore 40 cm/s.
The average rate of velocity change is change in vel / change in clock time. Velocity changes from 0 to 40 cm/s, a change of 40 cm/s. Clock time changes from 0 sec to 7.5 sec, a change of 7.5 sec. So
Quiz 0830:
Estimate the slope of the graph below and indicate the velocity and clock time at which the object reaches its average velocity on the time interval shown.
Also reason out whether the object travels further before or after it reaches its average velocity.
Estimate the minimum and maximum slope of the graph below and estimate the average velocity and the clock time at which the object reaches its average velocity on the time interval shown.
If the graph depicts the motion of a ball rolling down an incline what can you say about the shape of the incline?
In each case decide whether the average velocity is the average of the initial and final velocities. If not, is the average velocity greater than or less than the average of initial and final velocities?
University Physics (optional but recommended for others):
For each graph: