Physics I Quiz 00925
University Physics Only:
Velocity is the rate at which position changes with respect to clock time, and acceleration is the rate at which velocity changes with respect to clock time. If position is given by the function x(t) = 2 t^2 - 5 t + 12 then:
All students:
In the experiment where we determined the average horizontal velocity of the ball as it fell, would the ball gain more energy for a 10 cm rise when the book is on the tabletop or when the book is on the floor? In which case would the ball roll off the second book with the greater velocity?
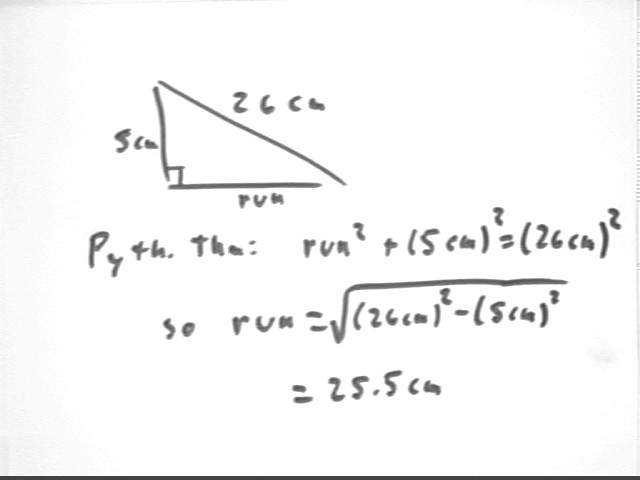
If the acceleration of a ball down an incline is equal to the slope of the incline multiplied by the acceleration of gravity, then for a book of length 26 cm and rise 5 cm what should be the velocity of the ball at the end of the book?
Strategy for finding vel at end of book: we know `ds and v0 = 0 (which we know from having done the experiment), and we have info to find accel. So we're going to be able to use the Fourth Equation of Unif Accel Motion to find the final velocity.
Slope is rise / run. You might think this is 5 cm / (26 cm) = .192 but 5 cm isn't the run, it's the hypotenuse. The run is sqrt(26^2 - 5^2) cm = 25.5 cm (see figure below). So really the slope is 5 cm / (25.5 cm) = .196.
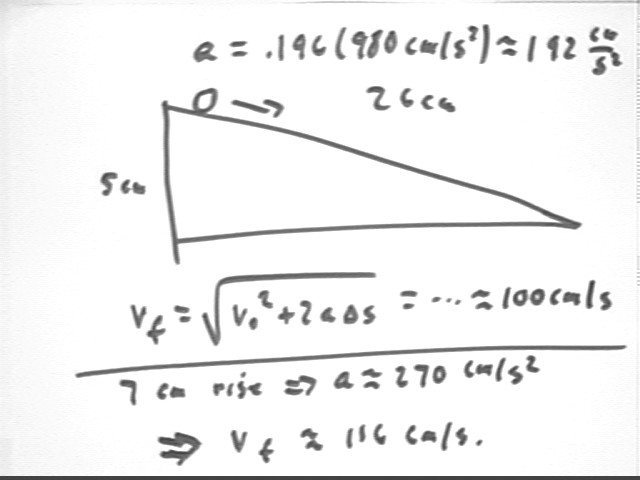
Thus acceleration is .196 * 980 m/s^2 = 192 cm/s^2.
Now we find vf = +-sqrt(v0^2 + 2 a `ds) = +- sqrt( 0^2 + 2 * 192 cm/s^2 * 26 cm) = .. = +- 100 cm/s.
If the ball rolls off the edge of the last book at this velocity and falls 96 cm, what will be its horizontal range?
Using v0 = 0, `ds = 96 cm and a = 980 cm/s^2 to analyze vertical motion we get `dt = .43 sec.
Horiz vel is 100 cm/s so horiz range is .43 sec * 100 cm/s = 43 cm.
Answer the same questions if the rise is 7 cm.
Using similar analysis we get accel about 270 cm/s^2 so vf = sqrt(v0^2 + 2 a `ds) = ... = 116 cm/s, approx.. This gives horiz range 116 cm/s * .43 s = 51 cm approx.
Use your information to plot two points on a graph of v^2 vs. rise and determine the slope of your graph. Compare to the ave slope of about 1000 (cm^2/s^2) / (cm of rise) obtained in the experiment.
The rises are 5 cm and 7 cm and velocities are about 100 cm/s and 116 cm/s.
We can assemble this information in a table:
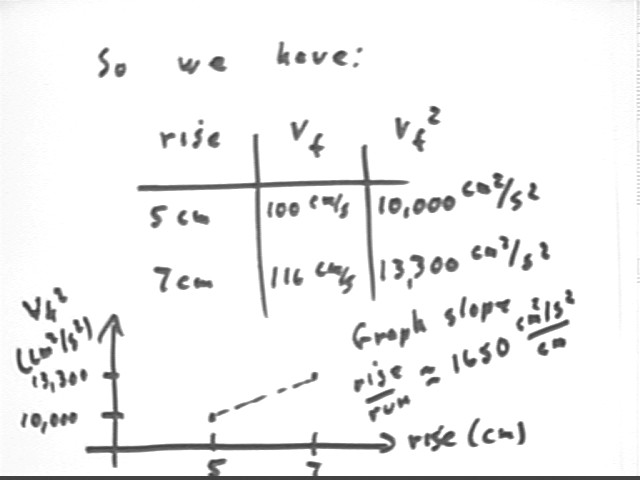
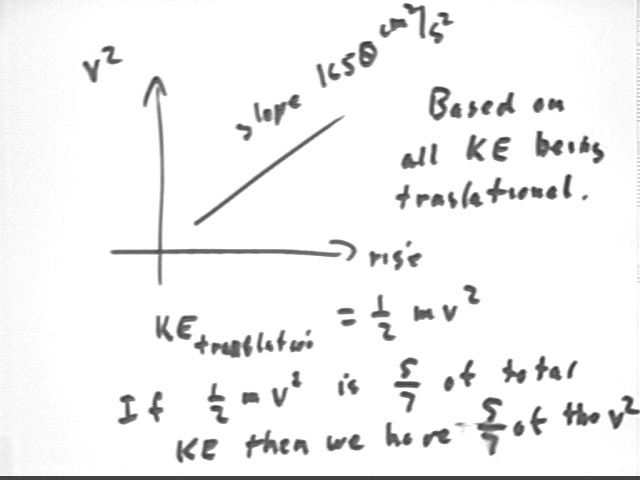
A graph of v^2 vs. rise would therefore have points (5 cm, (100 cm/s)^2 ) and (7 cm, (116 cm/s)^2 ) = (5 cm, 10,000 cm^2/s^2) and (7 cm, 13300 cm^2/s^2).
The slope of this graph is therefore rise / run = (13300 cm^2/s^2 - 10000 cm^2/s^2) / (7 cm - 5 cm) = 1650 (cm^2/s^2) / cm., as shown above.
This is about 60% higher than the observed slope of our graph of v^2 vs. rise, shown below.
It turns out that the energy gained by the ball as it rolls down the book doesn't all go into its energy of forward motion. The ball also rolls and some of the energy goes into making the ball spin. For reasons we'll see later we actually get only 5/7 of the v^2 as compared to what we get in our previous analysis. How would this modify the slope of the graph you obtained in the previous set of calculations?
The figure below shows how gravitational PE increases as we lift the ball from table to ramp, then decreases as the ball rolls down the ramp. The decreasing PE goes into increased KE, and to energy dissipated in friction and on small bumps. We also note again that KE is about 2/7 rotational and 5/7 translational (these figures are exact if their is no slipping between ball and book).
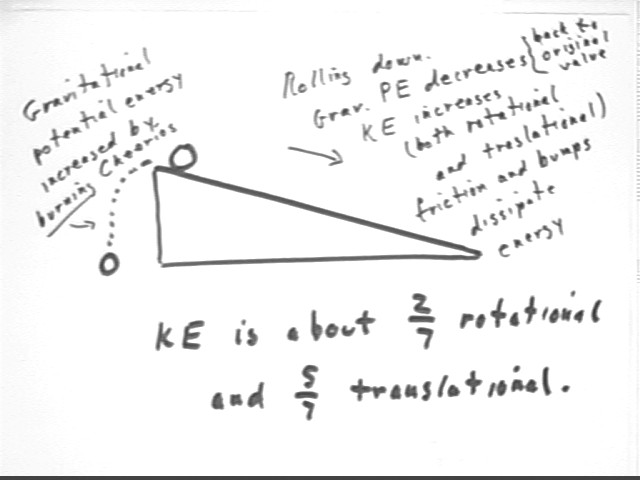
After accounting for spin, we are left with only 5/7 of the translational energy energy gained by the ball as it moves down the ramp, the rest going into rotation. Since translational KE is must .5 m v^2, we should therefore have only 5/7 of the predicted v^2.
This will reduce the predicted slope of the v^2 vs. rise graph to 5/7 of the 1650 cm^2/s^2 / cm, to about 1200 cm^2/s^2/cm, much closer to our observed 1040 cm^2/s^2/cm.
The remaining discrepancy is accounted for by the fact that some energy is lost to friction and 'bumps' and to experimental error.
Simple rates are easy if they concern money, and fairly easy in the context of motion. While thinking in the context money and motion, all simple rate problems are easy.
When we do calculations we always write down and think about the meaning of the units of the quantities involved. This is a very time-effective strategy for catching errors and for developing the ability to think through and solve problems.
An average rate of change of a quantity in time is represented as the slope between two points of a graph of that quantity vs. time.
The change of a quantity during a short time interval is approximated by the area under the trapezoid formed by the graph of that quantity vs. time, for that time interval.
Velocity and acceleration are defined as rates:
- The average velocity of an object moving along a straight line is therefore represented by the slope of a graph of position vs. clock time.
- ** The velocity function v(t) is the derivative of the position function s(t) for and object.
- The average acceleration of an object moving along a straight line is therefore represented by the slope of a graph of velocity vs. clock time.
- ** The acceleration function a(t) is the derivative of the velocity function v(t) for and object.
All the concepts of rates apply to position, velocity and acceleration and their relationships.
Applying the concepts of rates we see that changes in position and velocity can be obtained from knowledge of velocities and accelerations, respectively:
- The change in position of an object moving along a straight line is therefore approximated as the area under the appropriate trapezoid on a graph of velocity vs. clock time.
- The precise change in position is equal to the exact area under the graph of velocity vs. clock time, between the two given clock times.
- ** The change in position `ds between two clock times is the integral of the velocity function v(t) between the two corresponding clock times.
- The change in velocity of an object moving along a straight line is therefore approximated as the area under the appropriate trapezoid on a graph of acceleration vs. clock time.
- The precise change in velocity is equal to the exact area under the graph of acceleration vs. clock time, between the two given clock times.
- ** The change in velocity `dv between two clock times is the integral of the acceleration function a(t) between the two corresponding clock times.
The velocity of an object may change at a constant, an increasing, or a decreasing rate; the graph of velocity vs. clock time will reveal which.
If the velocity of an object changes at a constant rate, i.e., if the object accelerates uniformly, then
- If velocity does not change at a constant rate this is usually not the case.
** For uniform acceleration, a(t) = a = constant, so
- `ds = v0 `dt + .5 a `dt^2.
If an object accelerates uniformly over a time interval then the average velocity is halfway between the initial and final velocities. It follows that the change from the initial to the average velocity is the same as the change from the average velocity to the final velocity. Initial, average and final velocities will be 'equally spaced'.
If the position of an object is observed a series of clock times, its average velocity over each time interval can be easily determined. The approximate rate at which velocities change between midpoint times can then be easily determined.
The position vs. time, velocity vs. time, and rate of velocity change vs. time chronicles can be represented by graphs, with the 'y' coordinate of each graph representing the rates of change, or slopes, of the preceding graph. (i.e., the velocity graph represents as 'y' coordinates the slopes of the position graph, the acceleration graph represents at 'y' coordinates the slopes of the velocity graph)
If the velocity of an object is observed at a series of clock times, its approximate average velocity over each time interval is easily determined. The approximate distance the object moves over each time interval is then easily found. From the distances moved over the successive time intervals, the total change in the position of the object from the first clock time to any other clock time is then easily calculated.
Given a graph of velocity vs. clock time over a range of clock times, we can partition the graph by a series of time intervals.
The rate at which the velocity of an object changes is called its acceleration. Acceleration is rate of change of velocity.
If an object is accelerating in the direction of its motion, it is speeding up. If it is accelerating in the direction opposite to that of its motion, it is slowing down.
If an object accelerates perpendicular to its direction of motion, with zero acceleration in its direction of motion, then its direction of motion will change but its speed will not.
Newton's First Law observes that, in the absence of a net force, an object will not accelerate. An object which does not accelerate will change neither its speed nor its direction of motion.
In the vicinity of the surface of the Earth any freely falling object is observed to accelerate at very nearly the same constant rate, independent of where on Earth it is.
An object accelerating freely without resistance accelerates uniformly. On a uniform incline whose slope as measured from the horizontal direction is small this acceleration is very nearly equal to the product of the acceleration of gravity and the slope.
An object accelerating freely, except for the influence of friction, on a uniform incline with small slope will have greater acceleration for greater slope. The change in the acceleration from one slope to another will be very nearly equal to the product of the acceleration of gravity and the difference in the ramp slopes. Thus the slope of a graph of acceleration vs. ramp slope will be very nearly equal to the acceleration of gravity.
When an object is in free fall near the surface of the Earth, with no external forces other than gravity acting on it, the net force on the object is vertical, with no horizontal component.We can organize our thinking about a problem by using simple 'flow diagrams' showing the 'flow' of our reasoning. These diagrams can be extremely useful in 'mapping out' our solution strategies on complex situations.
For uniformly accelerated motion in one direction, we can reason out the motion using the quantities `ds, `dt, v0, vf, a, `dv, and vAve, and in terms of the units of these quantities.
To formulate uniformly accelerated motion in terms of `ds, `dt, v0, vf, and a, we begin by formulating the definitions of average acceleration and average velocity in terms of these five variables, obtaining two equations.
University Physics Quiz (with answers):
Velocity is the rate at which position changes with respect to clock time, and acceleration is the rate at which velocity changes with respect to clock time. If position is given by the function x(t) = 2 cm/s^2 * t^2 - 5 cm/s * t + 12 cm then:
Velocity is rate of change of position with respect to clock time so v(t) is the derivative of the x(t) function. Thus v(t) = 4 cm/s^2 * t - 5 cm/s.
Acceleration is rate of change of velocity with respect to clock time so a(t) is the derivative of the v(t) function. Thus a(t) = 4 cm/s^2. Note that this makes the situation a constant-acceleration situation.
The object is stationary when v(t) = 0. So we solve the equation 4 cm/s^2 * t - 5 cm/s = 0, obtaining t = 1.25 s. The object remains stationary only for this instant.
Average velocity is change in position / change in clock time. At t = 0 position is x(0) = 12 cm; at t = 5 s position is x(5) = 37 cm. So the average velocity is vAve = (37 cm - 12 cm) / (5 s - 0 s) = 5 cm/s.
Note that since v(t) is a linear function of t its average value is the average of its t = 0 and t = 5 s values. Since t(0) = -5 cm/s and t(5 s) = 15 cm/s, we conclude that vAve = (-5 cm/s + 15 cm/s) / 2 = 5 cm/s.
As we found before the object moves 25 cm, from position x = 12 cm to position x = 37 cm.
Do Chapter 4 text problems 4, 5, 6, 8, 9//
Text Chapter 4 Problems 32, 34, 35, 37, 38//