Physics I Quiz 1115
From other members of your group, who took data on the same stick you did, find the average velocities and accelerations obtained in different 'runs'. Construct a graph of magnitude of acceleration vs. ave. velocity and conjecture whether acceleration appears to depend in any systematic way on velocity. Comment on how your conclusion confirms the appropriateness of the assumption of uniform acceleration.
Some groups concluded that acceleration went down with increasing velocity, while others concluded the opposite.
Experiments
Experiment A: Using a stick and a marker top take the data that will allow you to investigate the relationship between velocity and angular acceleration.
The results obtained in the quiz lead us to the question of just what is the relationship between angular acceleration and ave angular velocity.
How might we investigate this experimentally?
It should be clear that we are going to want to obtain a graph of angular acceleration vs. average angular velocity. To make the comparisons valid we will want the observations to all be made on the same system.
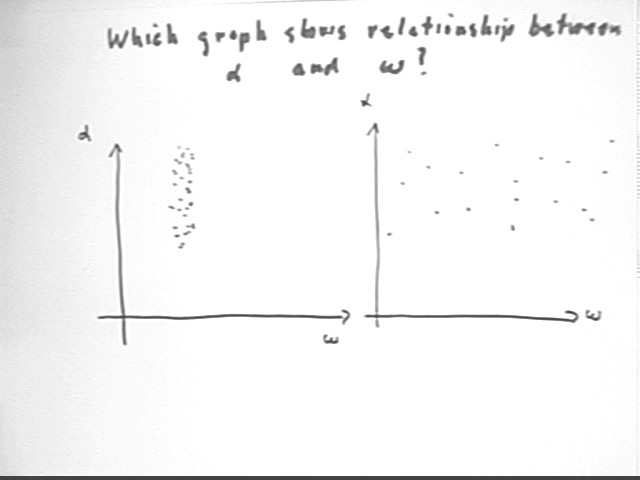
Assuming that angular acceleration is independent of angular velocity, and also that we might expect to have a degree of experimental uncertainty in our results, we might obtain a graph similar to either of the graphs below.
The first graph has very little variation in ave angular velocity; the fluctuations in angular acceleration are considered to be the result of experimental uncertainty.
The second graph has a wide range of ave angular velocities, with similar fluctuations in angular acceleration.
Which graph gives us the most information about the relationship?
The answer will be the graph for which we believe we can construct the most reliable curve for actual angular accel vs. angular velocity. This would be the second graph, which shows us that over a wide range of average angular velocities there is no strong tendency for average angular acceleration to change.
Your results might show something different but you should certainly obtain a wide range of angular angular velocities.
Note that the figure below is somewhat mislabeled. The omega representing ave angular velocity should be omegaAve, or omega with a bar over it. And the angular acceleration should similarly be ave angular acceleration.
Experiment B: Using wood blocks attached at symmetric points along the sticks investigate the relationship between angular acceleration and the distance of the blocks from the axis of rotation.
The key to interpreting this instruction is the phrase 'distance of the blocks from the axis of rotation' . This is the quantity that must be varied.
As we experienced in class the most stable configuration of the blocks is 'hanging' from the 'stick', which lowers the center of gravity below the balancing point and hence causes the system, when it wobbles slightly about its balancing point, to rotate back toward the equilibrium position. If the center of gravity is higher than the balancing point the effect of a wobble is to move the system away from equilibrium and cause the 'stick' to fall.
We also noted that the angular acceleration appeared to be much less than for the 'stick' by itself.
Experiment C: Finish the experiment begun last week using the orbital simulation to investigate orbital velocities and potential energies at different orbital distances. You will be given a specific orbital distance to investigate. Note that orbital velocities will be in the range of 3,000 - 10,000 m/s and if you're out of that range you've somehow managed to tap into a bug in the program that messes up the gravitational forces. If that happens holler at the instructor before you crash the International Space Station and try to blame it on VHCC.