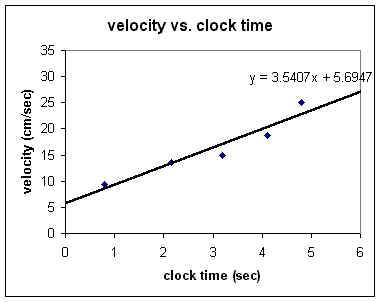
The table below shows ave. velocity vs. clock time data for positions 15 cm apart (see also
Velocity vs. Clock Time from Position vs. Clock Time Data). Each average velocity is associated with the midpoint clock time of the corresponding interval.clock time |
`dt |
mid time |
vAve |
0 |
1.6 |
0.8 |
9.375 |
1.6 |
1.1 |
2.15 |
13.63636 |
2.7 |
1 |
3.2 |
15 |
3.7 |
0.8 |
4.1 |
18.75 |
4.5 |
0.6 |
4.8 |
25 |
5.1 |
To find the approximate accelerations we must determine `dv / `dt for each pair of average velocities.
We note that the original data were taken from an actual experiment submitted by a student.
In addition to showing how accelerations can be inferred from position vs. clock time data, this analysis shows how small errors in observation can magnify themselves in a two-step process such as this one, where position vs. clock time data are used to approximate velocity vs. clock time, and the resulting velocity vs. clock time is used to predict the acceleration vs. clock clock time.
mid time |
vAve |
`dv | `dt | a = `dv / `dt |
0.8 |
9.375 |
4.4 | 1.35 | 3.3 |
2.15 |
13.63636 |
1.4 | .95 | 1.5 |
3.2 |
15 |
3.8 | .9 | 4.2 |
4.1 |
18.75 |
6.3 | .7 | 9 |
4.8 |
25 |
|||