Calculating Slope from a Data Table
Here we illustrate two common errors in calculating a
slope from linear data, based on some excellent data taken by a physics 121 student.
On Experiment 3, the following velocities
were obtained:
distance (cm) |
10 |
15 |
20 |
25 |
30 |
35 |
40 |
45 |
50 |
vel 1st ramp |
14.6 |
20.3 |
19.1 |
22.7 |
25.4 |
28.3 |
29.7 |
32.7 |
35.0 |
vel 2d ramp |
31.4 |
31.3 |
43.5 |
45.5 |
50.5 |
53.8 |
56.8 |
64.9 |
70.4 |
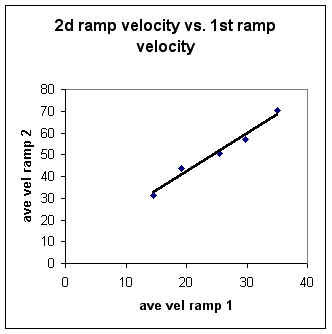
The student obtained the following slope for a graph of
2d ramp velocity vs. 1st ramp velocity:
- The slope of the graph should be
(64.9-70.4)/(32.7-35.0)=1.8333.
Instructor's response:
You did indeed calculate a slope correctly.
However, the slope you calculated is not the best representative slope for the data
points.
There are two easily corrected problems with your
choice of points:
- It looks like you used actual data points to
calculate your slope. You should rather have sketched a straight line to come as close to
the data, on the average, as possible and then used two widely separated points on this
line.
- Another problem with the points was that they were
chosen too close together. Minor errors have a much greater effect when you choose data
points close together. Had you chosen the first and last of your data points your slope
would have been 39 / 20.4 = 1.91. However, as noted before, you don't choose data points,
you use points on your best-fit line, which might not even go through any data points.
The graph below shows how a straight line might fit a set
of data points.
- Note that the line does not go through any data
points, but on the average comes as close as possible.
It is the slope of this trendline we wish to find, not
the slope between any pair of data points.