Analysis of Flow Experiment
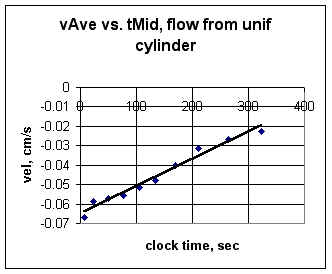
The graph below represents average velocity vs.
clock time for one student's depth vs. clock time data.
- The graph is reasonably linear, indicating possibly
uniform acceleration, but does show some possibly systematic deviations (first above, then
below, then above the straight line).
- These deviations might be due to some nonuniformity
in the shape of the container, to unavoidable experimental error, or to some nonuniformity
in the hole from which the water flows.
The table below shows the calculation of average velocity = depth change / `dt,
of the clock time corresponding to the midpoint of each time interval, of the `dt between
each set of mid clock times, of the velocity change between each set of mid clock times,
and the corresponding acceleration.
| clock time |
depth |
`dt |
depth
change |
mid
clock time |
ave
vel |
`dt
between mid clock times |
vel
change |
accel |
0 |
15 |
15 |
-1 |
7.5 |
-0.067 |
16 |
0.007843 |
0.00049 |
15 |
14 |
17 |
-1 |
23.5 |
-0.059 |
26 |
0.001681 |
0.000064 |
32 |
13 |
35 |
-2 |
49.5 |
-0.057 |
26.5 |
0.001587 |
0.000060 |
67 |
11 |
18 |
-1 |
76 |
-0.056 |
28.5 |
0.004274 |
0.00015 |
85 |
10 |
39 |
-2 |
104.5 |
-0.051 |
30 |
0.003663 |
0.000122 |
124 |
8 |
21 |
-1 |
134.5 |
-0.048 |
35.5 |
0.007619 |
0.000215 |
145 |
7 |
50 |
-2 |
170 |
-0.04 |
41 |
0.00875 |
0.000213 |
195 |
5 |
32 |
-1 |
211 |
-0.031 |
53.5 |
0.004583 |
0.000086 |
227 |
4 |
75 |
-2 |
264.5 |
-0.027 |
59.5 |
0.003939 |
0.000066 |
302 |
2 |
44 |
-1 |
324 |
-0.023 |
|
|
|
346 |
1 |
|
|
|
|
|
|
|
Acceleration values are not particularly uniform due to the crudity of the
equipment used. Acceleration values as calculated from depths of 15, 10, 5 and 0 cm
are more nearly uniform.