based on data by Physics 121 student lp
From T = period vs. L = length data we obtain a table of T vs. L.
Some of the data are shown in the table below:
| Length (in). | Period (sec) |
12 |
1.22 |
| 18 | 1.38 |
| 24 | 1.62 |
We create a table of log(T) vs. log(L) and graph this table.
(only some of the values, those corresponding to the previous table, are shown)
log(T) and log(L) values are calculated using the LOG button on a calculator.
log(L) |
log(T) |
1.079181 |
0.08636 |
1.255273 |
0.139879 |
1.380211 |
0.209515 |
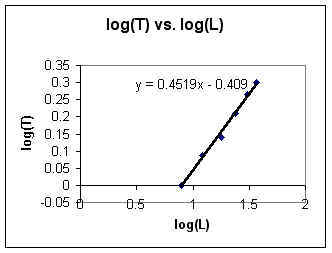
We draw a straight line fitting the points. The line indicated below is the best-fit regression line for all the data (not just the data shown in the sample tables).
The slope of the line is p = .45 and the y intercept (found by extending the line until it hits the y axis) is y0 = -.41.
The equation of T vs. L is T = 10 y0 * L p.
It follows that T = 10-.41 * L.45 = .39 L.45
Our model of period vs. length is therefore T = .39 L.45
The Precalculus details of this procedure are shown at the end of this page (click to see). Physics 121 students need not know these details. College Physics students should know them and University Physics students should know them.
At L = 12, 18, 24 inches you got T = 1.22, 1.38 and 1.62 seconds.
These values are to be compared with the predicted periods.
The predicted periods, based on T = .39 L^.45, would be 1.19, 1.43, 1.63, comparing favorably to your values .9, 1.22, 1.38 and 1.62.
The error with the first point is 1.22 - 1.19, which is .03.
This is about 3% of the observed .9.
The residuals (differences between data values and predictions) are .3, -.5 and -.1.
The corresponding errors are between .1% and .4%, which is very good accuracy.
We have y = .45 x - .41, approximately.
Thus log(T) = .45 log(L) - .41.
So 10log(T) = 10.45 log(L) - .41 = 10-.41 * 10.45 log(L) = .39 * [ 10log(L) ] .45 = .39 * L.45.
10log(T) = T, so we have T = .39 L.45.
Theoretically, from physics, we should have T = 2 `pi ( L / g ) .5.
For g = 9.8, this theoretical result is equivalent to T = .4 L.5.
This compares favorably with our empirical result, obtained from our data, of T = .39 L.45.