The first column of the figure below shows the clock times at which a ball accelerating down a uniform incline from rest passes each of a series of positions, with positions separated by 15 cm.
clock time |
`dt |
mid time |
vAve |
0 |
1.6 |
0.8 |
9.375 |
1.6 |
1.1 |
2.15 |
13.63636 |
2.7 |
1 |
3.2 |
15 |
3.7 |
0.8 |
4.1 |
18.75 |
4.5 |
0.6 |
4.8 |
25 |
5.1 |
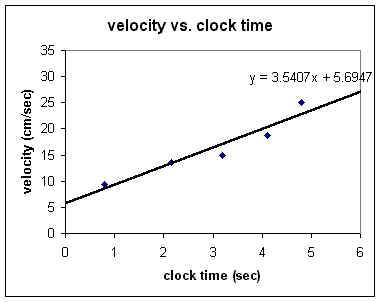
Below we see the corresponding graph of velocity vs. clock time, where the fourth column is plotted vs. the third..