Do these mini-experiments when they are assigned, then email the instructor with the following:
Mini-Experiment 1: Rolling an Object down an Incline
Mini-Experiment 2: Using a Calibrated Rubber Band
Mini-Experiment 3: Constructing Your Own Calibration Graphs
Mini-Experiment 4: Timing with the Pearl Pendulum
Mini-Experiment 1: Rolling an object down an incline.
Find something that will roll (the marble packed with your kit is fine, or you can use a can of food, a wheel, a small toy car, anything round or with wheels).
You're going to roll that object down an incline. For the incline use your physics book or another hardback book, or anything else that's reasonably straight. Prop up one end slightly (just a centimeter or two) so the object when placed at the higher end will roll down to the lower end. Measure how much higher one end is than the other, and measure the distance the object will roll along your incline from top to bottom. Measure these distances in centimeters.
You will release the object from rest at the top of the incline and let it roll freely to the bottom, while timing the process using your pulse as a timer. If you can't locate your pulse, then you may use something else as a timer.
Determine how many heartbeats are required for the object to roll down the incline. Release the object simultaneous with a heartbeat, and start counting with the next heartbeat. Estimate the time to the nearest half-heartbeat, or even closer if you think you can.
If you wish you can time your heartbeat and convert the heartbeats required for the object to roll down the incline to seconds, but this is not required. If you do so document your count and explain how you made the conversion to seconds.
Your description should include a description of the object and whatever it was you used for the incline, and how you observed the time.
Your data consist of the difference in height from one end to the other, the distance rolled by the object from one end to the other and the time required (the time can be measured either in heartbeats or in seconds).
Your analysis should include the answers to the following questions:
average rate = change in first quantity / change in second quantity.
If you have difficulty answering any of the questions you may answer with questions of your own.
Mini-Experiment 2: Using a Calibrated Rubber Band
Remember that it is very important that you never stretch any of your rubber bands by more than about 1/3 of their original length. Just don't stretch the things unless you are specifically instructed to do so, and always keep their length less than 12 cm.
Make 'S' hooks out of two of the paper clips which were included with the initial materials and place these hooks at the ends of the rubber band so will be able to stretch the rubber band slightly. Don't do this yet.
When you do slightly stretch the rubber band the whole thing will look something like this:
![]()
Using a ruler (if you don't have one you can print a pageful of rulers at Rulers) check to make sure that the length of your rubber band when pulled out to its full length but without any stretching is around 8 cm. If it isn't then before proceeding further email the instructor specifying what sort of ruler you are using and exactly how you are using it.
Place the rubber band, pulled out to its full length but not yet stretched, on the ruler and determine its maximum unstretched length.
If your rubber band's maximum unstretched length is less than 9.0 cm, then
If your rubber band's maximum unstretched length is more than 9.0 cm, then
Now read the information under Interpreting a Rubber Band Calibration Graph. That document talks about Rubber Band #4 in a set of 6 calibrated rubber bands, which you don't yet have. However the graph is read the same way as the graph you received with your initial materials, so everything applies.
The calibration graph you will use is the one shown in Interpreting a Rubber Band Calibration Graph.
You will now determine the rubber band in your set that most closely approximates this rubber band.
Using your calibration graph, whose highest plateau also corresponds to 11.5 cm and whose plateaus represent .5 cm differences in length, determine how much force you were feeling at each of the lengths specified previously (half-centimeter intervals from max unstretched length to max stretched length).
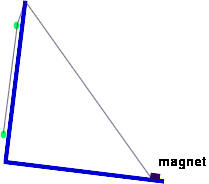
Use a second rubber band and another paper clip from your initial materials to construct the following configuration with the new rubber band and the calibrated rubber band:
![]()
Holding the S hooks at far left and far right stretch the system out so that the original calibrated rubber band has lengths 9.0, 10.0 and 11.0 cm. At each length determine the length of the second rubber band.
Briefly describe what you did.
Report the force exerted by the calibrated rubber band at lengths of 9.0, 10.0 and 11.0 cm.
Report the lengths of the second rubber band when the first rubber band had lengths of 9.0, 10.0 and 11.0 cm.
Answer the following questions:
How much force do you think you had to exert to hold the calibrated rubber band at lengths of 9.0, 10.0 and 11.0 cm?
How much force do you think the second rubber band was exerting at each of the lengths you reported?
If you gradually stretched the calibrated rubber band from the 9.0 to the 10.0 cm length what average force do you think you would have to exert?
How much force do you think the second rubber band exerts when it (not the calibrated rubber band) is 9.0 cm long? How much force do you think it exerts at the 10.0 cm and 11.0 cm lengths? Explain how you made your estimates.
Mini-Experiment 3: Constructing Your Own Calibration Graphs
Taking Data for Calibration:
Note: You should not stretch any of the marked rubber bands more than 35% beyonds its maximum unstretched length. If you stretch a rubber band beyond this length you will permanently distort it. This means, for example, that if a rubber band is 8 cm long you should not stretch it by more than 2.8 cm, to a maximum length of 10.8 cm.
Important: Throughout the course you will be using the four rubber bands and the calibration graphs you make here, so be sure you keep the rubber bands and the graphs in a place where you can locate them, and be sure the graphs are clearly labeled so you know which one goes with which rubber band.
For this experiment you will use one of the plastic bags that came with your initial lab materials and the small 'tub' which contains a lump of play-dough, along with a ruler, paper clips and marked rubber bands.
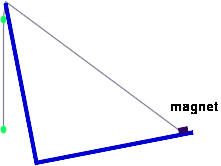
Using paperclips bent into the shape of hooks, form a 'chain' of all four of your rubber bands (a chain of two rubber bands is shown below). Be sure you observe which is which--they will have 1, 2, 3, and 4 marks made with a permanent marker. It shouldn't be hard to spot them among the dozen or so rubber bands included with your materials.
(Two additional rubber bands, with 5 and 6 marks respectively, are also included and either may be substituted for any of the first four. Again, just be sure you know which is which.)
![]()
Hang the plastic bag from the chain.
Fill the play-dough tub with water, right to the brim and pour the water into the bag. The water in the bag will be hanging from
Measure the length of each of your rubber bands. Be sure you keep track of which is which.
Ddd another tubful of water and measure again, as before.
Continue adding tubfuls of water and measuring until one of the rubber bands exceeds its original length by 30%, then stop.
Compiling and Graphing your Data
Each tubful is pulled downward by the Earth's gravitational field. Each rubber band resists this force by stretching out, which creates a tension equal and opposite to the force exerted by the Earth (each rubber band also supports the rubber bands below it, but the rubber bands don't weigh much so we neglect that weight). The force exerted by the Earth on each tubful is about .21 Newtons.
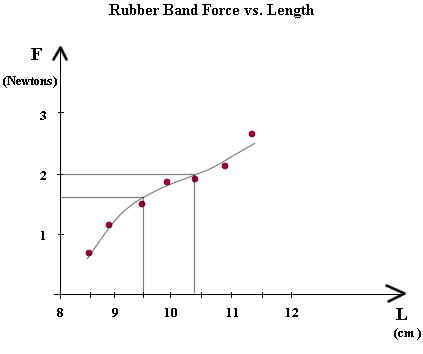
Make a table of the force exerted by each rubber band vs. the length of the rubber band. The length will go in the first column. You will do this for each of the four rubber bands. Your graph will be of the type shown below, but you probably won't have that many data points and your forces will differ from the ones indicated by this graph.
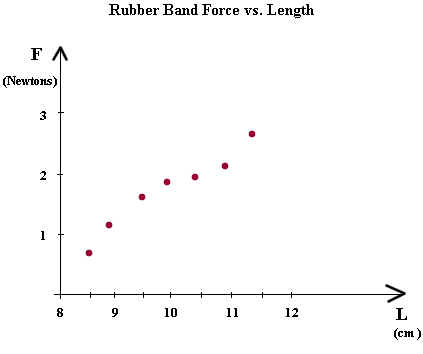
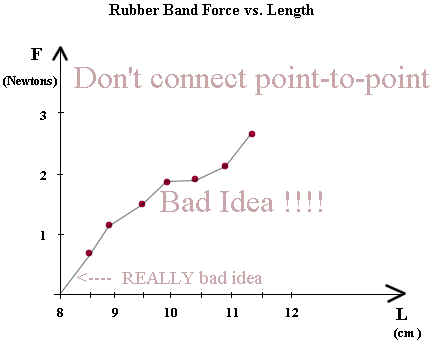
There is a tendency for students at the beginning of a physics course to connect graphs point-to-point. This is a usually a very bad idea in physics, since there are experimental uncertainties in our data and we learn nothing by following those uncertainties around. The graph below is an example of this Bad Idea.
Note also the REALLY bad idea, which is to treat the 'origin' as if it is a data point. We never measured the force at the 8 cm length, and there is no justification at all for using the 'origin' (actually it's not the origin, it's the point (8 cm, 0) ) as a data point.
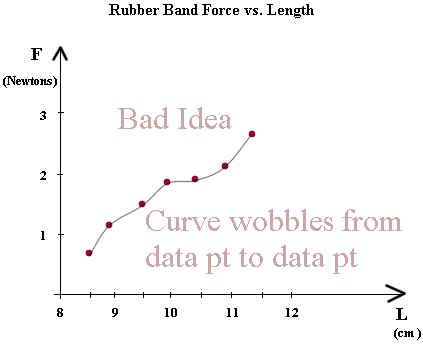
It is a good idea to add a smooth curve to the data. This is because we expect that force will change smoothly with rubber band length. However we acknowledge that errors might occur in our data, so we never attempt to make the smooth curve pass through the actual data points, though we don't try to avoid them either.
In the example below the curve wobbles around from point to point instead of smoothly following the trend of the points.
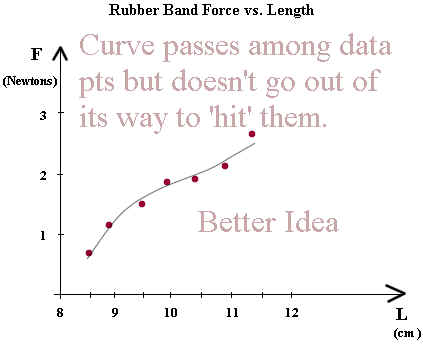
In the next example the curve doesn't try to 'hit' each data point, but rather to follow the pattern of the actual force vs. length. It passes among the data points, remaining as smooth as possible and coming as close as possible to the data points without making unsightly 'wobbles' in an attempt to pass through specific data points.
Estimating Forces
We can now use our curve to estimate the force at a given length, or to estimate the length that will give us a specified force.
In the figure below we estimate the force for the 9.5 cm length.
From the data point it might appear that the force corresponding to 9.5 cm is about 1.5 Newtons. However we're going to put our trust in the curve.
We project a line from the L = 9.5 point on the horizontal axis, straight up to the curve, then straight over to the F axis.
Reading the point on the y axis as F = 2.6 or maybe F = 2.7 we see that the curve gives us a force between 2.6 and 2.7 Newtons.
If our curve has been drawn carefully and if it appears to make good sense then we believe that the curve is more reliable than our data points, and we will tend to believe this estimate more than our data point.
Similarly we use the curve to estimate the length that gives us a force of 2 Newtons.
We project a horizontal line from the F = 2 point on the vertical axis to the curve, then from this point we project vertically downward to the horizontal axis.
We read a length of about 10.4 cm. Again we use the curve, which 'averages out' the characteristics of several data points, to estimate the required length.
If you haven't already done so, include in your report a table of your data for force vs. length for each of the four selected rubber bands.
Now for the first rubber band, sketch your best smooth curve, the one you believe best shows the real force vs. length behavior of a rubber band. Describe your curve and describe your thinking about how to construct the curve.
Use your curve for the first rubber band (the one with 1 mark) to do the following:
Estimate the force corresponding to a length of 9.8 cm.
Estimate the length of a rubber band that gives a force of 2.4 Newtons.
From the curve estimate the force corresponding to each of the lengths 8.5, 9, 9.5, 10, 10.5, 11 and 11.5 cm. Give your estimates.
By how much did each of the forces you just estimated differ from the data you obtained from the calibration graph?
Which do you have more faith in, the values from the curve you just created or the values you read from the original calibration graph, and why?
Give also your estimates of the force exerted by the second rubber band (the one with two marks) at a length of 9.8 cm.
Finally sketch the curves for the other three selected rubber bands. Use your curves to estimate the force exerted by each rubber band when its length is 10 cm.
Mini-Experiment 4: Timing with the Pearl Pendulum
The Pearl Pendulum consists of two fake pearls on a string, with one pearl glued to a metal bracket, plus a small ceramic magnet. In the figure depicts the two pearls, with the lower pearl pulled away from the bracket. When the pearl is released it swings back to the bracket, bounces off the swings back again, repeatedly striking the bracket. The string can be pulled through the glued pearl, lengthening or shortening the distance between the pearls. The magnet can be used to fix the other end of the string so the length of the pendulum remains constant.
You should set the system up and allow the pearl to bounce off the bracket a few times. Note whether the pearl strikes the bracket more and more frequently or less and less frequently with each bounce. If the pearl does not bounce off the bracket several times after being released, it might be because the extra string below the pearl is getting in the way; you can use the knife packed with your kit to trim the string.

If the bracket is tilted back a bit, as shown in the figure below, the pearl will naturally rest against the bracket. Tilt the bracket back a little bit and release the pendulum.
Listen to the rhythm of the sounds made by the ball striking the bracket.
If the bracket is tilted forward a bit, as shown in the figure below, the pearl will naturally hang away from the bracket. Tilt the bracket forward a little bit (not as much as shown in the figure, but enough that the pearl definitely hangs away from the bracket) and release the pendulum. Note whether the pearl strikes the bracket more and more frequently or less and less frequently with each bounce.
Again listen to the rhythm of the sounds made by the ball striking the bracket.
If the bracket is placed on a perfectly level surface, the pearl will hang straight down, just barely touching the bracket. Most surfaces aren't perfectly level. Place the bracket on surface and if necessary tilt it a bit by placing a shim beneath one end or the other, until the hanging pearl just barely touched the bracket. Pull the pearl back then release it.
If the rhythm of the pearl bouncing off the bracket speeds up or slows down, adjust the level of the bracket, either tilting it a bit forward or a bit backward, until the rhythm becomes steady.

Report the results of the three setups. In which did the rhythm speed up? In which did the rhythm slow down? How did you adjust the last setup to make the rhythm constant?
Using the pendulum to set a counting rhythm:
Use the setup that gave you the most constant rhythm. Release the pendulum and count 0-1-2-3-4-1-2-3-4 ... (count zero on the first sound then just keep counting 1-2-3-4) along with the sounds made by the pendulum striking the block. Do this a couple of times.
Now release the pendulum and keep counting in the same rhythm until you have counted 1-2-3-4- a total of 4 times. The pendulum is not likely to hit the block this many times; but you can use the pendulum to set the rhythm of your count.
Timing an object rolling down an incline:
Finally set up a small slope, as in Mini Experiment 1, and roll the marble (or another convenient object) down the slope. Measure the length of the pendulum, from the top of the first small block to the center of the pearl. You need not measure anything, but place a barrier at the end of the path so you can hear exactly when the object reaches the barrier.
Repeat this 11 times, writing down the result of each. Do not tamper with the ramp--leave it exactly as it was on the first trial.
Report and analyze your results:
Report your 11 counts. Also describe the object you rolled down the incline.
Use your results to make your best estimate of the number of counts required:
Convert your results to standard units, using what we know about the period of a pendulum:
How much uncertainty is there in your final result?
Consider whether the pendulum could be modified to measure the time more accurately:
Mini Experiment 5, Timing the Fall of an Object
You will use the pendulum timer and your marble to find the time required for an object to fall to the floor.
Set your pendulum to have the greaest length possible. Test it to be sure the rhythm of the bouncing pearl is steady.
Pull back the pearl and at the same time raise the marble as high above the floor as possible. If the floor is carpeted you should put something (e.g., a textbook) on the floor so you can hear when the marble hits it.
Release the marble and the pearl at the same time and count how many times the pendulum strikes the bracket (count 1-2-3-4 ... ) before the pendulum hits the floor.
Between which two counts did the marble hit the floor (e.g., was it between count 4 and count 5, between count 3 and count 4, etc. ...).
Using Tt = sqrt(L) and the length of your pendulum, how long was it from the time of release of the pendulum until the first strike?
Mini Experiment 6, Acceleration of a Toy Car
In this experiment you will determine whether the acceleration of a freely rolling toy car on a level surface is reasonably consistent.
First roll the car:
Then take some data:
Using this information find the average velocity of the car. For each of your four trials:
... angular velocity
... how is it that this rhythm is steady even though the pendulum is making shorter and shorter oscillations?