This experiment is in the process of being edited into a form, and should be posted in that format within a couple of hours. You may safely begin work on the experiment, but wait until the web-form version is posted to enter and submit your results.
You should have completed the rubber band calibration experiment, in which you created calibration graphs for your rubber bands and were instructed to keep track of the rubber bands and their calibration graphs. If you do not have those rubber bands you will need to get some #33 rubber bands and repeat that experiment.
This experiment uses three calibrated rubbers bands, a paper clip, the 1-foot square of 1/4-inch plywood, three push pins and a paper clip.
Commonsense Warning: The push pins used in this experiment can be pushed through the plywood square, so be sure to protect any surface on which you set up this experiment. For example, it is not recommended that you place the plywood square on valuable furniture, then stick pins through it.
Set up the experiment:
1. Print out the grid, which should give you a printout with 1-cm squares. Place this grid on the plywood square. (Place an accurate ruler on the grid and verify that the squares indeed line up with the 1-cm marks. If they don't email the instructor and include the number of millimeters, to the most accurate fraction of a mm you can estimate, by which the grid is off on a 10-cm measurement in the horizontal direction, and the number of mm of error on a 10-cm measurement in the vertical direction.)
You may also print out a page of rulers. Be sure to right-click on the page with the rulers, then click on Print. Otherwise you might print out the top frame of the page, which is not what you want here. These rulers should be accurate to within a fraction of a millimeter over their 22-cm length. Measure them and be sure they are indeed accurate. Note that the markings on these rulers might not be perfect, due to limitations of pixel placement, and that this may introduce an additional small element of uncertainty in the results of your measurements.
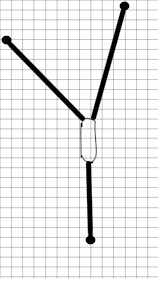
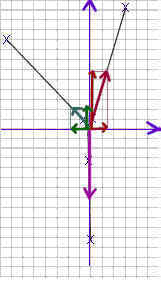
2. Using a paper clip, three rubber bands and three push pins set up the system as shown in the figure below. In the figure the dark thick lines represent the rubber bands, all three of which are attached directly to the paper clip. The small circles at the other end of each rubber band represents a push pin. The setup should have the following characteristics:
- One rubber band (the one lowest in the figure below) should run along one of the vertical lines of the grid. In the figure the lowest rubber band isn't quite parallel to the vertical line. Make sure yours is parallel and that it's on the line.
- Don't let any rubber band exceed 10.5 cm in length. The one most likely to exceed this length is the one parallel to the vertical grid lines. Keep an eye on that one as you position the other two. It would be a good idea to check your calibration graphs to see which rubber band is capable of exerting the most force at this length, and use that for the 'vertical' rubber band.
- The second rubber band will be directed toward the upper left and will be angled at least 45 degrees to the left of vertical. This rubber band should stretched to a length that will cause it to exert a force of about 1 Newton.
- The third rubber band should exert enough force to cause the lower rubber band to stretch to at least 10 cm, but not to exceed 10.5 cm in length. It will probably need to be closer to vertical than the second rubber band. Remember that the lower rubber band has to be parallel to the vertical lines.
- It's not shown that way in the picture but you should use paper clips bent into hooks to attach the rubber bands to the push pins. That will prevent the push pins from 'crushing' the rubber bands and preventing the ends from stretching, and it will also make it much easier to accurately mark the positions of the ends of the rubber bands. However the 'hooks' can't be too long, or the system won't fit on the board.
Be very sure that the 'downward' rubber band is stretched to between 10.0 and 10.5 cm, and that it is parallel to the vertical gridlines.
Mark the positions of the ends of the rubber bands, measure their lengths and determine the force exerted by each:
1. Using a pencil with a good point or a reasonably fine-tipped pen make an x under the end of each rubber band, with the x crossing directly under the very end of the rubber band. Locate this mark as accurately as possible. The first figure below indicates the positions of the x's (note that the x's under the circles representing push pins will in fact be under hooks at the ends of the rubber bands).
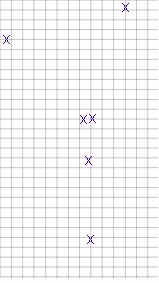
2. Once you have marked both ends of each rubber band all your information will be on the grid, and you may remove the pins, the rubber bands and the paper clip. The second figure above shows the grid as it would be with just the x's marked.
3. Using a ruler measure the length, in cm, of each rubber band, based on the distance between your marked points.
4. Using the appropriate calibration graph or calibration function determine the force exerted by each rubber band.
In the box below give the length of each rubber band and the corresponding force in Newtons, in this order and separated by a comma:
`ta
Set up coordinate axes on the grid, select a point on each line and draw projection lines to determine coordinates; use coordinates to determine angles:
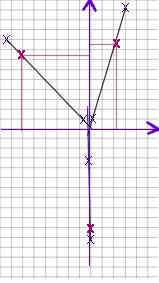
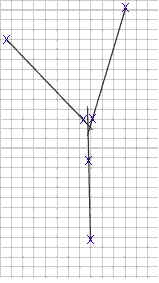
1. Find the point at which the lines of force meet. For each rubber band use a straightedge to draw a line along the center of the former position of the rubber band. Extend all three lines to their point of intersection. The first figure below illustrates the lines corresponding to the above figures.
2. Construct a y vs. x coordinate system whose origin is at the point where the three lines of force intersect, as shown in the second figure below.

3. Locate on each line of force the point which is 10 cm from the intersection, as indicated by the heavy red x's in the first figure below. For each rubber band, just measure 10 cm from the origin, along the line of force.
4. Sketch the projection line from each of these points to the x and y axes, as shown in the second figure below. Since one point is already on the y axis it isn't necessary to sketch its projection lines.
5. Determine the x and y coordinate of the point selected on each line of force. For example in the picture the x and y coordinates of the line in the first quadrant are about 2.3 and 8.5, so the point is (2.3, 8.5). Note that the point (2.3, 8.5) isn't really 10 cm from the origin; when you located your points you hopefully did much better.
Report your results in the box below, x and y in comma-delimited format, one rubber band to a line. Report with the rubber bands in the same order you reported previously:
`ta
6. Find the angle of each line of force by calculating the inverse tangent of the y coordinate divided by the x coordinate, making sure your calculator is in degree mode. For example, for the point (2.3, 8.5) we would get an angle equal to arctan(8.5 / 2.3) = 74.9 degrees, approximately.
On a calculator you can use the inverse tangent function (usually INV and TAN keys, or 2d function and TAN). Be sure you are in degree mode if you want the angle in degrees, and in radian mode if you want the angle in radians.
If you use Excel you can use the ATAN function (for this angle you would type =ATAN(8.5 / 2.8) into a cell). Excel gives angles in radians, which you can convert to degrees if you multiply by 180 / `pi (you could just type in = ATAN(8.5 / 2.8) * 180 / PI(), which will give you the angle in degrees. Note that pi() is Excel's way of denoting `pi).
7. Find the clockwise angle made by each direction with the positive x axis, as measured in the counterclockwise direction from the positive x axes.
Report your angles in the box below, one to a line, reporting the rubber bands in the same order as before:
`ta
8. Verify that all your points were really 10 cm from the origin by using the Pythagorean Theorem; i.e., by calculating `sqrt( x^2 + y^2 ), where x and y are the coordinates of the points. For the point (2.3, 8.5), for example, you would get `sqrt( 2.3^2 + 8.5^2) = 9.2, approx.. The result should be 10. Obviously whoever located the point on the above graph didn't do a very good job. Hopefully your results will be better.
Give the results of the Pythagorean theorem in the box below, reporting in each line, in comma-delimited format, the result you obtained and its deviation from the ideal 10 cm. Report three lines, one for each rubber band, reporting in the same order as previously:
`ta
Draw to scale the force vectors corresponding to the rubber band forces, determine their components and find their sum. Note carefully that you are drawing force vectors here, NOT the lengths of the rubber bands. You are now done with the lengths of the rubber bands. Those lengths were only used to find the forces and they are no longer important.
1. Using a scale of 4 cm per Newton sketch the vector representing the force exerted by each rubber band (the force, not the length of the rubber band). Use a different color or style for the vector corresponding to each rubber band; you might use pens of different colors, or you might use pencil for one, pen for another, and another pen with a different color or a line of clearly distinct thickness.
2. Each vector should originate at the origin, should lie along the line of force and be directed in the direction of the force exerted on the paper clip by the rubber band. The first figure below illustrates three vectors representing forces of roughly 1.5 Newtons, .6 Newtons and 1.8 Newtons.
3. Now draw the projection lines, sketch the component vectors, and validate the components as calculated from these sines and cosines: From the tip of each vector sketch the projection lines back to the x axis and to the y axis. Be sure the projection lines run parallel to the grid lines and use a straightedge to locate the projection lines as accurately as possible.
4. Using the same colors and/or line styles you used to sketch the vectors, sketch the component of each of the force vectors along the x and y axes, as shown in the second figure below.
5. Measure the length of each of these components, and using the 4 cm to 1 Newton scale determine as accurately as possible how many Newtons are represented by each component. In the figure below it looks like the red vector in the first quadrant has components measuring 1.4 cm in the x direction and about 5.8 cm in the y direction. These forces would correspond to .35 Newtons and 1.45 Newtons.
Enter your measurements in the box below. In each line enter 4 numbers, the first and second being the x and y components of your sketches, in cm, and the second and third being the corresponding x and y forces. Enter one line for each rubber band, using the same order of rubber bands as before. Note each quantity you report will be positive or negative, depending on whether that quantity is in the direction of the corresponding axis or opposite the direction of that axis (i.e., right and left are + and -, respectively; up and down are also + and - respectively).
`ta
In the box below, report in the first line the total of the x components of all your forces, and in the second line the total of the x components of all your forces.
`ta
Add the three vectors by the polygon method:
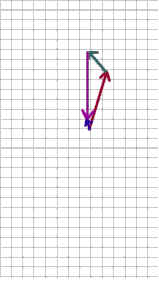
1. Again sketch your three force vectors, this time arranged to form a polygon. Let the terminal point of each vector be the initial point of the next. That is, the vectors should be connected head to tail, as illustrated in the first figure below.
2. Now sketch a vector from the initial point of the first vector to the terminal point of the last vector (represented by the short blue vector in the second and third figures below). What are the coordinates of this resultant vector (the coordinates for the present example are illustrated in the fourth figure below)?
Give the x and y coordinates of the points on your actual graph, in cm, then the x and y coordinates of the corresponding force components, in Newtons, in a single line below, in comma-delimited format.
`ta

3. Are the components of your resultant vector reasonably consistent with the results you got in the preceding activity when you added the components of the vectors? Answer in the box below.
`ta
4. What is the magnitude of the force vector indicated by your sketch? Use the pythagorean theorem to calculate the magnitude of the resultant force vector, as indicated by the components you gave in the preceding box. Give your magnitude in the first line and explain starting in the second line how you calculated it:
`ta
Add the three vectors by calculating components:
1. For each rubber band use the magnitude and the angle of the force it exerts to determine the x and a y component of that force. List in the box below, using comma-delimited format, the magnitude, angle, x component and y component of each vector. List one vector per line, in the order of rubber bands used throughout this experiment. Starting in the third line explain in detail how you calculated the components of the second of these vectors:
`ta
2. What is the sum of all your x components? What is the sum of all your y components? You previously obtained x and y components graphically, first using a sketch and projection lines, then using the polygon method of addition. Compare your results with the results you obtained before.
In the first line below give, in comma-delimited format, the sum of your x components, as found here, then the sum as found using the first sketch and projection lines, and finally the x component you obtained by the polygon method. Give in the seconds line the same information for the sum of the y components. Beginning in the third line comment on the relative accuracy of the various methods:
`ta
Compare what you got with the ideal result:
1. What is the actual sum of the x components of the forces that actually occurred, in the real world, when you perform this experiment? What is the actual sum of all the y components?
2. What is the resultant vector corresponding to these components? What is the magnitude of this resultant?
Report the answers to these two questions in the box below, and explain how you know that your answers must be so:
`ta
3. For each of the three methods of calculating the resultant of the three forces, your error is the magnitude of the difference between the expected result in the actual result, your actual result being the resultant you obtained. Express the magnitude of your error as a percent of the largest of the three force vectors. Give in the first line the magnitude of your error, and the percent error, for the first graphical method. In the second line give the same information for the polygon method of addition. In the third line give the information for your calculations based on magnitudes and angles of the three vectors.
`ta