class 050902
Read Chapter 1 of your textbook and read over the problems.
Pick one of the `dTheta vs. `dt data lines in this table (not one of your own) and sketch the corresponding graph of angular velocity vs. clock time. You may assume constant angular acceleration, so that your graph of angular velocity vs. clock time will be linear.
Pick another `dTheta vs. `dt line, one with a very different `dTheta than the one you just picked, and by the most direct method determine the angular acceleration.
| `dt (sec) | `dTheta (deg) |
| 13 | 4250 |
| 9 | 1330 |
| 3 | 220 |
| 3 | 205 |
| 7 | 1470 |
| 5.5 | 1095 |
| 5 | 595 |
| 4 | 310 |
| 5 | 460 |
| 3 | 205 |
| 12 | 4005 |
| 5 | 370 |
| 5 | 223 |
| 2 | 530 |
| 8 | 1590 |
| 12 | 3720 |
| 8.69 | 1600 |
| 7.6 | 1360 |
| 9.05 | 2380 |
| 4 | 455 |
| 5 | 750 |
| 2 | 135 |
Reported:
| `dt (sec) | `dTheta (deg) | omegaAve (deg/sec) | alpha (deg / s^2) |
| 13 | 4250 | 322.92 | 25.198 |
| 9 | 1330 | 147.7 | 16.4 |
| 3 | 220 | 73.3 | 24.4 |
| 3 | 205 | 68.33 | 45.55 |
| 7 | 1470 | 210 | 60 |
| 5.5 | 1095 | 199.09 | 72.396 |
| 5 | 595 | 119 | 47.6 |
| 4 | 310 | 77.5 | 19.4 |
| 5 | 460 | 92 | 36.8 |
| 3 | 205 | 68 | 45 |
| 12 | 4005 | 333.75 | 55.34 |
| 5 | 370 | 74 | 25 |
| 5 | 223 | 44.6 | 17.84 |
| 2 | 530 | 265 | 133 |
| 8 | 1590 | 198.75 | 24.84 |
| 12 | 3720 | 310 | 25.83 |
| 8.69 | 1600 | 184.12 | 21.19 |
| 7.6 | 1360 | 178.95 | 23.55 |
| 9.05 | 2380 | 262.98 | 29.05 |
| 4 | 455 | 113.7 | 56.8 |
| 5 | 750 | 150 | 60 |
| 2 | 135 | 67.5 | 33.75 |
Corrected:
| `dt (sec( | `dTheta (deg) | omegaAve | omega0 | `dOmega | alpha | ratio of calculated to reported |
| 13 | 4250 | 326.9231 | 653.8462 | -653.846 | -50.2959 | -1.99603 |
| 9 | 1330 | 147.7778 | 295.5556 | -295.556 | -32.8395 | -2.00241 |
| 3 | 220 | 73.33333 | 146.6667 | -146.667 | -48.8889 | -2.00364 |
| 3 | 205 | 68.33333 | 136.6667 | -136.667 | -45.5556 | -1.00012 |
| 7 | 1470 | 210 | 420 | -420 | -60 | -1 |
| 5.5 | 1095 | 199.0909 | 398.1818 | -398.182 | -72.3967 | -1.00001 |
| 5 | 595 | 119 | 238 | -238 | -47.6 | -1 |
| 4 | 310 | 77.5 | 155 | -155 | -38.75 | -1.99742 |
| 5 | 460 | 92 | 184 | -184 | -36.8 | -1 |
| 3 | 205 | 68.33333 | 136.6667 | -136.667 | -45.5556 | -1.01235 |
| 12 | 4005 | 333.75 | 667.5 | -667.5 | -55.625 | -1.00515 |
| 5 | 370 | 74 | 148 | -148 | -29.6 | -1.184 |
| 5 | 223 | 44.6 | 89.2 | -89.2 | -17.84 | -1 |
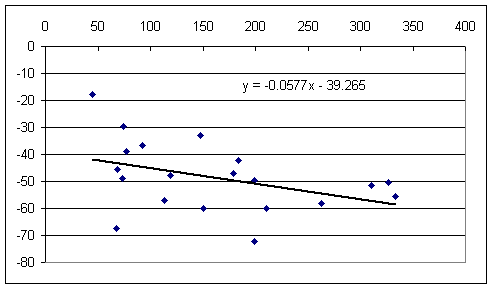
| 2** | 530** | 265** | 530** | -530** | -265** anomalous value | -1.99248** |
| 8 | 1590 | 198.75 | 397.5 | -397.5 | -49.6875 | -2.0003 |
| 12 | 3720 | 310 | 620 | -620 | -51.6667 | -2.00026 |
| 8.69 | 1600 | 184.1197 | 368.2394 | -368.239 | -42.3751 | -1.99977 |
| 7.6 | 1360 | 178.9474 | 357.8947 | -357.895 | -47.0914 | -1.99964 |
| 9.05 | 2380 | 262.9834 | 525.9669 | -525.967 | -58.1179 | -2.00062 |
| 4 | 455 | 113.75 | 227.5 | -227.5 | -56.875 | -1.00132 |
| 5 | 750 | 150 | 300 | -300 | -60 | -1 |
| 2 | 135 | 67.5 | 135 | -135 | -67.5 | -2 |

Burnin' Questions:
Rubber Band Data:
Put your rubber band data into a spreadsheet, with each 10-number list of positions in a column, and email to
Again, be sure you put the data into columns; one column for each series of numbers, starting in cell D5.
Make a graph of the force vs. length behavior of each rubber band:
For the 1-mark rubber band, sketch a graph of force vs. length, using what you know about the rubber band from the 1 N, 2 N and 3 N observations. Your length axis can run from 8 cm to 12 cm, your force axis from 0 N to 4 N.
Repeat for each of the other rubber bands.
Answer the following questions based on your graphs:
How much force would all 5 of your rubber bands exert if they were connected in parallel and stretched to 9 cm, to 10 cm, and to 11 cm? Give the total force that would be exerted at each of these lengths.
If we needed a force of 10 Newtons, how could we use a combination of your rubber bands to get it? Give a specific numerical answer.