Mini-Experiment 3: Constructing Your Own Calibration Graphs
Taking Data for Calibration:
Note: You should not stretch any of the marked rubber bands more than 35% beyonds its maximum unstretched length. If you stretch a rubber band beyond this length you will permanently distort it. This means, for example, that if a rubber band is 8 cm long you should not stretch it by more than 2.8 cm, to a maximum length of 10.8 cm.
Important: Throughout the course you will be using the four rubber bands and the calibration graphs you make here, so be sure you keep the rubber bands and the graphs in a place where you can locate them, and be sure the graphs are clearly labeled so you know which one goes with which rubber band.
For this experiment you will use one of the plastic bags that came with your initial lab materials and the small 'tub' which contains a lump of play-dough, along with a ruler, paper clips and marked rubber bands.
Using paperclips bent into the shape of hooks, form a 'chain' of all four of your rubber bands (a chain of two rubber bands is shown below). Be sure you observe which is which--they will have 1, 2, 3, and 4 marks made with a permanent marker. It shouldn't be hard to spot them among the dozen or so rubber bands included with your materials.
(Two additional rubber bands, with 5 and 6 marks respectively, are also included and either may be substituted for any of the first four. Again, just be sure you know which is which.)
![]()
Hang the plastic bag from the chain.
Fill the play-dough tub with water, right to the brim and pour the water into the bag. The water in the bag will be hanging from
Measure the length of each of your rubber bands. Be sure you keep track of which is which.
Ddd another tubful of water and measure again, as before.
Continue adding tubfuls of water and measuring until one of the rubber bands exceeds its original length by 30%, then stop.
Compiling and Graphing your Data
Each tubful is pulled downward by the Earth's gravitational field. Each rubber band resists this force by stretching out, which creates a tension equal and opposite to the force exerted by the Earth (each rubber band also supports the rubber bands below it, but the rubber bands don't weigh much so we neglect that weight). The force exerted by the Earth on each tubful is about .21 Newtons.
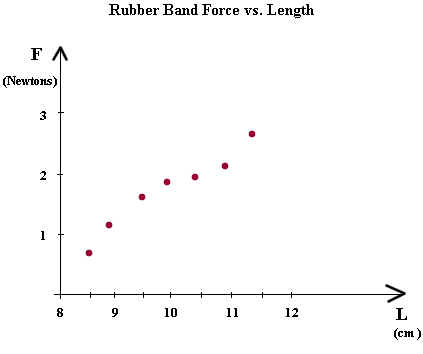
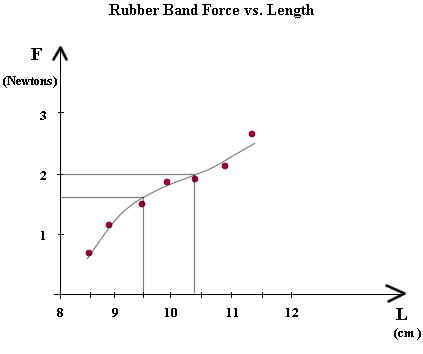
Make a table of the force exerted by each rubber band vs. the length of the rubber band. The length will go in the first column. You will do this for each of the four rubber bands. Your graph will be of the type shown below, but you probably won't have that many data points and your forces will differ from the ones indicated by this graph.
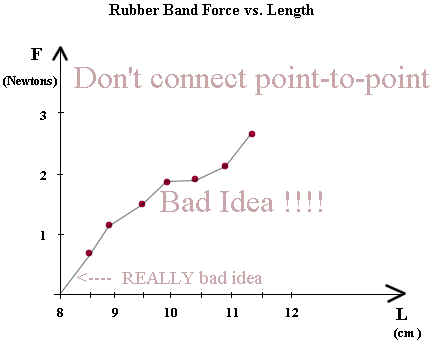
There is a tendency for students at the beginning of a physics course to connect graphs point-to-point. This is a usually a very bad idea in physics, since there are experimental uncertainties in our data and we learn nothing by following those uncertainties around. The graph below is an example of this Bad Idea.
Note also the REALLY bad idea, which is to treat the 'origin' as if it is a data point. We never measured the force at the 8 cm length, and there is no justification at all for using the 'origin' (actually it's not the origin, it's the point (8 cm, 0) ) as a data point.
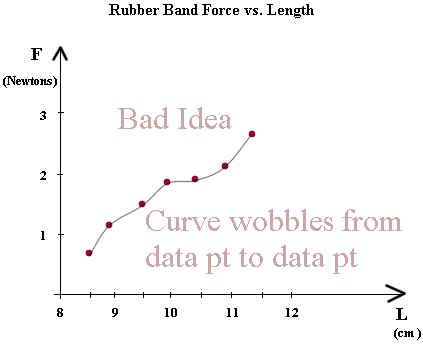
It is a good idea to add a smooth curve to the data. This is because we expect that force will change smoothly with rubber band length. However we acknowledge that errors might occur in our data, so we never attempt to make the smooth curve pass through the actual data points, though we don't try to avoid them either.
In the example below the curve wobbles around from point to point instead of smoothly following the trend of the points.
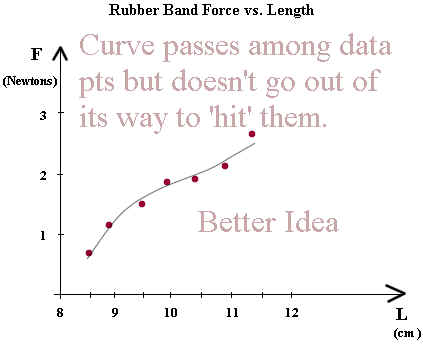
In the next example the curve doesn't try to 'hit' each data point, but rather to follow the pattern of the actual force vs. length. It passes among the data points, remaining as smooth as possible and coming as close as possible to the data points without making unsightly 'wobbles' in an attempt to pass through specific data points.
Estimating Forces
We can now use our curve to estimate the force at a given length, or to estimate the length that will give us a specified force.
In the figure below we estimate the force for the 9.5 cm length.
From the data point it might appear that the force corresponding to 9.5 cm is about 1.5 Newtons. However we're going to put our trust in the curve.
We project a line from the L = 9.5 point on the horizontal axis, straight up to the curve, then straight over to the F axis.
Reading the point on the y axis as F = 2.6 or maybe F = 2.7 we see that the curve gives us a force between 2.6 and 2.7 Newtons.
If our curve has been drawn carefully and if it appears to make good sense then we believe that the curve is more reliable than our data points, and we will tend to believe this estimate more than our data point.
Similarly we use the curve to estimate the length that gives us a force of 2 Newtons.
We project a horizontal line from the F = 2 point on the vertical axis to the curve, then from this point we project vertically downward to the horizontal axis.
We read a length of about 10.4 cm. Again we use the curve, which 'averages out' the characteristics of several data points, to estimate the required length.
If you haven't already done so, include in your report a table of your data for force vs. length for each of the four selected rubber bands.
Now for the first rubber band, sketch your best smooth curve, the one you believe best shows the real force vs. length behavior of a rubber band. Describe your curve and describe your thinking about how to construct the curve.
Use your curve for the first rubber band (the one with 1 mark) to do the following:
Estimate the force corresponding to a length of 9.8 cm.
Estimate the length of a rubber band that gives a force of 2.4 Newtons.
From the curve estimate the force corresponding to each of the lengths 8.5, 9, 9.5, 10, 10.5, 11 and 11.5 cm. Give your estimates.
By how much did each of the forces you just estimated differ from the data you obtained from the calibration graph?
Which do you have more faith in, the values from the curve you just created or the values you read from the original calibration graph, and why?
Give also your estimates of the force exerted by the second rubber band (the one with two marks) at a length of 9.8 cm.
Finally sketch the curves for the other three selected rubber bands. Use your curves to estimate the force exerted by each rubber band when its length is 10 cm.