More practice with interpretation of graphs
This worksheet is in response to the following question:
I feel like I am getting better at working the graphs. Sometimes I think I
understand it
better when you go over it, but when i have to do it on my own I'm not as clear.
Could you
give some extra problems for force vs. position and velocity vs. time graphs
that we could
work at home if we want to?
When working with graphs of this nature, you will generally be trying to
interpret the
slope and area of a trapezoid or a series of trapezoids.
For each trapezoid you need to ask yourself a series of questions:
- What is the rise along the top of the trapezoid?
What is the run?
- What is the average 'altitude' of the trapezoid?
What is its width?
- You divide the rise by the run to get the slope. What is your result?
- You multiply average altitude by width to get the area. What is
the area?
Then you ask the interpretation questions:
- What does the rise between two points of the graph represent?
- What does the run between two points of the graph represent?
- What does the average altitude of the trapezoid in question
represent?
- What does the width of the trapezoid in question represent?
- What does it mean to multiply the quantity represented by the average
altitude by the
quantity represented by the width? This is the meaning of the area.
- What does it mean to divide the quantity represented by the rise by
the quantity represented
by the run? This is the meaning of the slope.
Note that the slope generally has a meaning as a rate of change of one
quantity with respect to the other. The area doesn't always necessarily
have a very meaningful interpretation, but very often it will.
Some of the situations described below might not all be familiar to you,
so the interpretations won't necessarily have a lot of meaning, but some should
and you can still practice the process of interpretation using these graphs.
If you want feedback, you can copy this document into your word processor
and fill in the blanks, then submit it to the instructor using the form.
The graphs won't show but the questions and your answers will and the instructor
will know what each one means:
Graph 1 below represents velocity in cm / s vs. clock time in seconds.
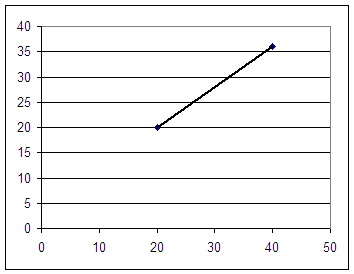
- What is the rise along the top of the trapezoid?
What is the run?
- What is the average 'altitude' of the trapezoid?
What is its width?
- You divide the rise by the run to get the slope. What is your result?
- You multiply average altitude by width to get the area. What is
the area?
- What does the rise between two points of the graph represent?
- What does the run between two points of the graph represent?
- What does the average altitude of the trapezoid in question
represent?
- What does the width of the trapezoid in question represent?
- What does it mean to multiply the quantity represented by the average
altitude by the
quantity represented by the width? This is the meaning of the area.
- What does it mean to divide the quantity represented by the rise by
the quantity represented
by the run? This is the meaning of the slope.
Graph 2 below represents position in cm vs. clock time in seconds.
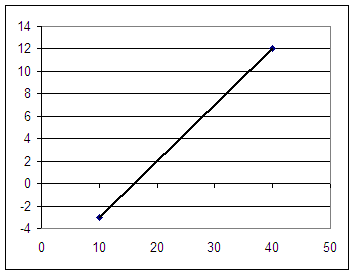
- What is the rise along the top of the trapezoid?
What is the run?
- What is the average 'altitude' of the trapezoid?
What is its width?
- You divide the rise by the run to get the slope. What is your result?
- You multiply average altitude by width to get the area. What is
the area?
- What does the rise between two points of the graph represent?
- What does the run between two points of the graph represent?
- What does the average altitude of the trapezoid in question
represent?
- What does the width of the trapezoid in question represent?
- What does it mean to multiply the quantity represented by the average
altitude by the
quantity represented by the width? This is the meaning of the area.
- What does it mean to divide the quantity represented by the rise by
the quantity represented
by the run? This is the meaning of the slope.
Graph 3 below represents force in Newtons vs. clock time in seconds.
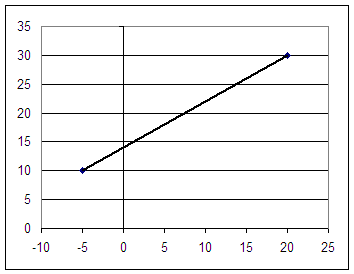
- What is the rise along the top of the trapezoid?
What is the run?
- What is the average 'altitude' of the trapezoid?
What is its width?
- You divide the rise by the run to get the slope. What is your result?
- You multiply average altitude by width to get the area. What is
the area?
- What does the rise between two points of the graph represent?
- What does the run between two points of the graph represent?
- What does the average altitude of the trapezoid in question
represent?
- What does the width of the trapezoid in question represent?
- What does it mean to multiply the quantity represented by the average
altitude by the
quantity represented by the width? This is the meaning of the area.
- What does it mean to divide the quantity represented by the rise by
the quantity represented
by the run? This is the meaning of the slope.
Graph 4 below represents force in Newtons vs. position in meters.
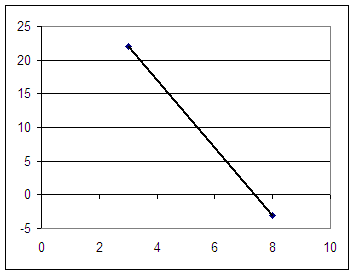
- What is the rise along the top of the trapezoid?
What is the run?
- What is the average 'altitude' of the trapezoid?
What is its width?
- You divide the rise by the run to get the slope. What is your result?
- You multiply average altitude by width to get the area. What is
the area?
- What does the rise between two points of the graph represent?
- What does the run between two points of the graph represent?
- What does the average altitude of the trapezoid in question
represent?
- What does the width of the trapezoid in question represent?
- What does it mean to multiply the quantity represented by the average
altitude by the
quantity represented by the width? This is the meaning of the area.
- What does it mean to divide the quantity represented by the rise by
the quantity represented
by the run? This is the meaning of the slope.
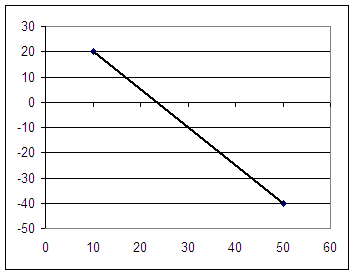
Graph 5 below represents acceleration in cm / s^2 vs. clock time in
seconds.
- What is the rise along the top of the trapezoid?
What is the run?
- What is the average 'altitude' of the trapezoid?
What is its width?
- You divide the rise by the run to get the slope. What is your result?
- You multiply average altitude by width to get the area. What is
the area?
- What does the rise between two points of the graph represent?
- What does the run between two points of the graph represent?
- What does the average altitude of the trapezoid in question
represent?
- What does the width of the trapezoid in question represent?
- What does it mean to multiply the quantity represented by the average
altitude by the
quantity represented by the width? This is the meaning of the area.
- What does it mean to divide the quantity represented by the rise by
the quantity represented
by the run? This is the meaning of the slope.
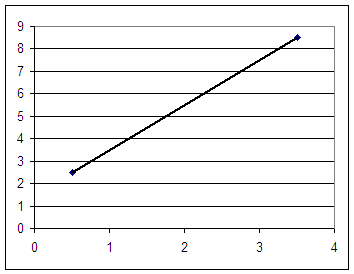
Graph 6 below represents energy in Newton meters vs. position in cm.
- What is the rise along the top of the trapezoid?
What is the run?
- What is the average 'altitude' of the trapezoid?
What is its width?
- You divide the rise by the run to get the slope. What is your result?
- You multiply average altitude by width to get the area. What is
the area?
- What does the rise between two points of the graph represent?
- What does the run between two points of the graph represent?
- What does the average altitude of the trapezoid in question
represent?
- What does the width of the trapezoid in question represent?
- What does it mean to multiply the quantity represented by the average
altitude by the
quantity represented by the width? This is the meaning of the area.
- What does it mean to divide the quantity represented by the rise by
the quantity represented
by the run? This is the meaning of the slope.
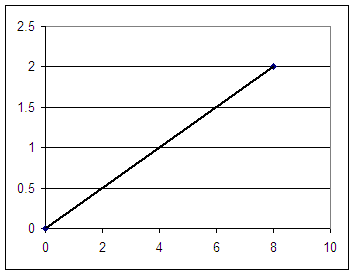
Graph 7 below represents electric field in N / m vs. position in m.
- What is the rise along the top of the trapezoid?
What is the run?
- What is the average 'altitude' of the trapezoid?
What is its width?
- You divide the rise by the run to get the slope. What is your result?
- You multiply average altitude by width to get the area. What is
the area?
- What does the rise between two points of the graph represent?
- What does the run between two points of the graph represent?
- What does the average altitude of the trapezoid in question
represent?
- What does the width of the trapezoid in question represent?
- What does it mean to multiply the quantity represented by the average
altitude by the
quantity represented by the width? This is the meaning of the area.
- What does it mean to divide the quantity represented by the rise by
the quantity represented
by the run? This is the meaning of the slope.
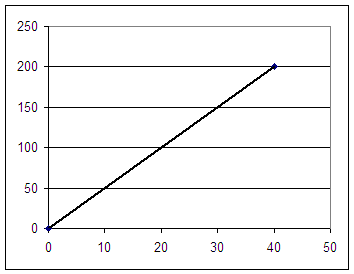
Graph 8 below represents the gravitational potential energy of a loaded
airplane in megaJoules vs. altitude in meters.
- What is the rise along the top of the trapezoid?
What is the run?
- What is the average 'altitude' of the trapezoid?
What is its width?
- You divide the rise by the run to get the slope. What is your result?
- You multiply average altitude by width to get the area. What is
the area?
- What does the rise between two points of the graph represent?
- What does the run between two points of the graph represent?
- What does the average altitude of the trapezoid in question
represent?
- What does the width of the trapezoid in question represent?
- What does it mean to multiply the quantity represented by the average
altitude by the
quantity represented by the width? This is the meaning of the area.
- What does it mean to divide the quantity represented by the rise by
the quantity represented
by the run? This is the meaning of the slope.


