0830 Quiz
1. If between clock times t = 5 sec and t = 15 sec an object travels from position 12 cm along a meter stick to position 80 cm then
Ave vel = ave rate of change of position = change in position / change in clock time = (80 cm - 12 cm) / (15 sec - 5 sec) = 68 cm / (10 sec) = 6.8 cm/s.
Common response is that the final velocity is 6.8 cm/s. If we take this response to the next step, we conclude that the average of initial and final velocities is the average of 0 cm/s and 6.8 cm/s, which is 3.4 cm/s.
However a graph of v vs. t is a straight line, since velocity changes at a constant rate. So the average velocity occurs at the midpoint of the line segment representing this time interval, and for a straight-line graph the midpoint value is the average value.
We would conclude that the midpoint value is 6.8 cm/s from the given information, but that it must be 3.4 cm/s from the common response given here.
Cain't be both.
How to fix the conclusion?
What must be averaged with the initial velocity 0 cm/s to get the average velocity 6.8 cm/s?
Must be 13.6 cm/s, since (0 cm/s + 13.6 cm/s) / 2 = 6.8 cm/s.
Don't confuse final velocity with average velocity.
If we answered the previous question correctly this will be true, since rate of change of velocity (i.e., acceleration) is uniform.
Note that this won't necessarily be the case if acceleration is not uniform.

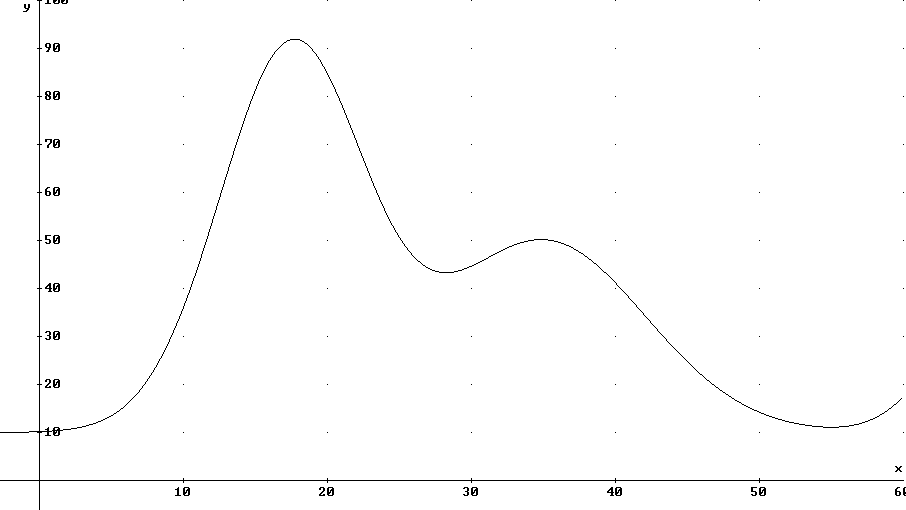
If the graph above represents the expected number of really stupid things in any given day I would do at different ages:
The third decade runs from age 20 to age 30. The maximum number of stupid things per day looks like it occurred at age 20, and was around 85 stupid things / day. The minimum number appears to be in late 20's where i was doing around 45 stupid things / day. The average of these two rates is about 65 stupid things / day.
Over the 10-year period, in which there were about 3650 days, this gives over 200,000 stupid things.
If this graph represents the velocity in cm / s of a marble rolling down a long, undulating incline vs. clock time in seconds then
Greatest velocity is about 90 cm/s. In 60 sec the displacement would be (90 cm/s) * 60 s = 5400 cm, approx., or about 54 meters.
Least velocity is about 10 cm/s, which in 60 sec would give you a distance of 10 cm/s * 60 s = 600 cm, or about 6 meters.
Velocity appears to be increasing most rapidly at around t = 14 sec, where the graph is steepest.
This is the point at which the rate of change of velocity with respect to clock time, i.e., acceleration, takes its greatest value.
'How far' can be identified here with change in position.
ave vel = change in position / change in clock time.
So
change in position = ave vel * change in clock time.
We use ave vel, not change in vel, not final vel, not initial vel, not our favorite vel.
Eyeballing the interval we see that the velocity ranges from around 40 cm/s to around 50 cm/s, probably averaging a little close to 40 cm/s. Let's estimate the average velocity on this interval as 44 cm/s.
We get
On the graph the 44 cm/s represents the average altitude of the graph and the 10 s represents the width of the graph region beneath the curve. The area of the rectangle with altitude 44 cm/s and width 10 s is ht * width = 44 cm/s * 10 s = 440 cm.
The area beneath the curve of a v vs. t graph corresponding to a given time interval is the displacement that will occur during that interval.
Univ Phy: The area beneath the curve for an interval is the definite integral of the function over that interval.
Intuitively you will probably say that the acceleration is greatest around t = 14 sec, which is where the graph is steepest. This is correct. In detail:
Average acceleration is average rate of change of velocity with respect to clock time.
Average rate of change of velocity with respect to clock time is change in velocity / change in clock time.
On the graph change in velocity is represented by the rise between two points, and change in clock time by the run.
So the average acceleration between two points on a v vs. t graph is represented by rise / run = slope.
Sketching a line whose slope matches the maximum slope we can then find two points on that line and find its slope. The two points we get are (6s, 0 cm/s) and (13 s, 80 cm/s), giving us a slope of (80 cm/s - 0 cm/s) / (13 s - 6 s) = 80 cm/s / (7s) = 11.4 (cm/s) / s approx..
A straight horizontal line at about v = 37 cm appears to about split the area of the graph into equal regions above and below the line, so 37 cm is a decent estimate of the average velocity, off by perhaps +- 2 cm/s.
So a reasonable estimate of the total distance might be 37 cm/s * 60 s = 2220 cm, about 22 meters.
If this graph represents the position in cm of a marble rolling down a long, undulating incline vs. clock time in seconds then