0901 Quiz
1. A graph of v vs. t consists of a straight line segment from (4 sec, 6 cm/s) to (9 sec, 18 cm/s). Sketch this segment on a graph of v vs. t.
The slope is
rise / run
= (18 cm/s - 6 cm/s) / (9 sec - 4 sec)
= 12 cm/s / (5 s)
= 2.4 (cm/s)/s.
The rise is 12 cm/s, which is the change in the vertical coordinate of the graph. The vertical coordinate measures velocity, so the rise is change in velocity.
The run is 5 s, which is the change in the horizontal coordinate of the graph. The horizontal coordinate measures clock time, so the run is change in clock time.
The slope is rise / run, which in this case is change in velocity / change in clock time. This is the definition of rate of change of velocity with respect to clock time, or acceleration.
Since the graph is linear the midpoint velocity is halfway between initial and final velocities (by the symmetry of the segment about the midpoint), so midpoint velocity is (6 cm/s + 18 cm/s) / 2 = 12 cm/s.
The midpoint velocity is the average velocity (by the symmetry of the graph about the midpoint, since the v vs. t graph is linear).
Displacement is average vel * change in clock time, so the object travels (12 cm/s) * 5 s = 60 cm.
2. A graph of position vs. t consists of two straight line segments, one from (4 sec, 8 cm) to (9 sec, 68 cm) and another from this point to (12 sec, 140 cm).
The slope of the first segment is
slope = rise / run
= (68 cm - 8 cm) / (9 sec - 4 sec)
= 60 cm / (5 sec)
= 12 cm/s.
Since the vertical coordinate measures position, the rise is the change in the position of the object; in this case the rise is 60 cm which means that the position changed by +60 cm.
The run of the segment is 5 sec, which is the change in horizontal coordinate. The horizontal coordinate measures clock time, so the run is change in clock time.
The slope of the segment is rise / run, which for this example means change in position / change in clock time, or average rate of change of position with respect to clock time.
In this situation we find that this average rate is 60 cm / (5 s) = 12 cm/s. The average rate of change of position with respect to clock time is also called the average velocity of the object.
The change in position is 60 cm, which corresponds to the rise of the graph.
The slope of the second segment is (140 cm - 68 cm) / (12 sec - 9 sec) = 72 cm / (3 sec) = 24 cm/s.
Using the same sequence of interpretation we find that this is the average velocity on the second segment.
3. For the graph of #1, what does the graph of position vs. t look like for the time interval described by the graph?
The displacement between t = 4 sec and t = 9 sec was found to be 60 cm. On a position vs. t graph the displacement is the rise. So we know that between t = 4 sec and t = 9 sec, the position vs. clock time graph has a rise of 60 cm.
We know from the v vs. t graph that the velocity increases from 6 cm/s to 18 cm/s between these clock times. The velocity of the object is the slope of the position vs. clock time graph. So the slope of our position vs. clock time graph has to increase from 6 cm/s to 18 cm/s.
Questions to Ask when Interpreting a Graph
A graph of A vs. B has quantity A on the vertical axis, quantity B on the horizontal axis.
Any graph you sketch should be labeled in the following manner:
When you analyze a graph you typically ask the following questions:

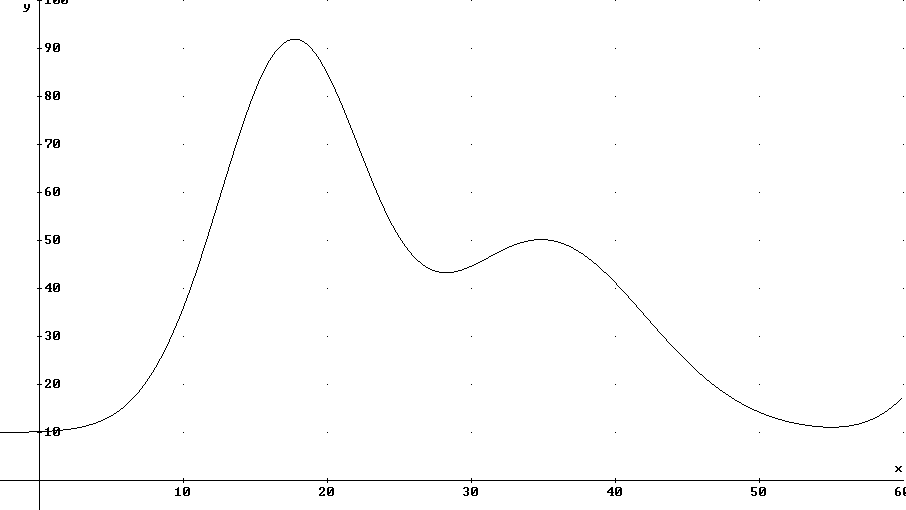
If this graph represents the position in cm of a marble rolling down a long, undulating incline vs. clock time in seconds then