"
Class Notes 8/24/98
Velocity and Acceleration
Two of the most fundamental
quantities we measure in physics are velocity and acceleration. Here we begin
to work out the meaning of these concepts within the familiar context of a ball
rolling down an incline. We work with the idea of a rate. We develop ways of
representing these ideas and meanings by graphs, and we design an experiment to
verify the obvious fact that there is an increase in velocity as a ball rolls
down an incline.
Today we
- develop the concept of average velocity
- devise an experiment to test our
expectations of how average velocity on an incline changes with the slope of
the incline
- consider the nature of the graph of
velocity vs. clock time
- use the concept of rate
- introduce the concept of acceleration
- show how average acceleration, defined as
average rate of change of velocity, can be represented on a graph
- show how we might think of and define
acceleration at an instant
Our starting idea is that when a ball is
rolled down an incline we expect it to speed up. Our
experience of inclines leads us to the following questions:
- What do we mean by velocity?
- How can we determine the velocity of
a ball rolling down an incline?
- We anticipate from our experience
that a ball traveling down a greater incline, starting from rest, will
experience a greater change in velocity. How can we determine whether the
velocity actually changes, and whether the velocity increases in the manner
that we expect?
- How could we determine the velocity
of the ball at a specific point?
- How do we determine the rate at
which the velocity changes? How can we understand the concept of the rate
at which velocity changes?
You will be asked to design and conduct an
experiment using a timer and a ball on a ramp to
- prove that when a ball rolls down
the ramp, its average velocity on the 'second', or lower, half of the ramp
is greater than on the initial half
- determine as closely as possible the
ratio of the average velocity on the lower half to that on the initial half.
http://youtu.be/YddWjY7aSNA
http://youtu.be/vSKw6KJhysQ
We can determine the average
velocity of an object by
determining the time required to
travel through a known
displacement.
- For example, if a ball travels 40 cm
in a time of six arm swings, then the average velocity of the ball is 40 cm
/ 6 armswings = 6.67 cm / armswing.
We call this an average
velocity because the velocity
keeps changing as the ball
rolls down the incline.
- We are pretty sure of our reasoning
that since the ball starts out at less than 6.67 cm / armswing, and since it
always increases in velocity, it ends up at more than 6.67 cm/armswing.
The idea of average rate can be understood by
analogy with the average rate at
which we are paid.
- If we work several different jobs in a
given week, each paying any different rate, and if in 50 hours we earn $400,
then at what average rate are we being paid per hour? The answer is
obviously 8 dollars per hour. We can visualize the $400 broken up into 50
parts, with each part representing an hour's pay. During some hours we made
more than during others, but it all averages out to 8 dollars per hour.
- Similarly we can visualize the 40 cm we
move during 6 armswings broken into 6 parts, with each part representing an
average distance move to during an armswing of time. We might move different
distances during different armswings, but we average 6.67 cm per armswing.
- Note that 6.67 cm per armswing is written
6.67 cm/armswing. This way of writing the average velocity represents the
fact that we are dividing the number of cm by the number of armswings. We
can read the ' / ' which indicates division as 'per'.
We can test whether
a ball traveling down a greater incline, starting from rest, does in fact
experience a greater change in its velocity.
- We will roll a ball down a variety
of different inclines all of the same length. We time the ball on each
incline, from a fixed starting point to another fixed point.
- If the time required to go down an
incline is always less on any greater incline, then we conclude that the
ball picked up more speed on the steeper incline.
We might imagine riding inside a ball
rolling down an incline. If we imagine that we have some sort of speedometer in
the ball, we expect that the speedometer
needle would move, perhaps at a constant rate and perhaps at either an
increasing or a decreasing rate.
- It is important to
understand that the motion of an object is not represented by the motion of
its speedometer. An object can be moving very fast while its speedometer
remains perfectly still.
- Imagine a car with perfect
cruise control traveling (illegally) at an unchanging velocity of 80 mph.
The car is certainly moving, but its speedometer remains stationary.
- If we step harder on the
gas, our velocity will increase while if we step on the brakes, our velocity
will decrease. In that case our speedometer will move.
- Similarly, if we coast down
a steep hill, we expect the speedometer to move.
The graph below depicts velocity vs. clock
time for a ball. There are two possible curves on the graph. The red curve
shows a velocity which increases at a constant
rate, while the red curve shows a velocity which increases faster and
faster.
We say that velocity is represented by the blue
curve is increasing at an
increasing rate. We might also think about what the curve might look like
the velocity is increasing, but at a decreasing rate.
- When velocity changes at a constant rate,
the velocity vs. clock time curve is a straight line.
- When velocity is increasing at an
increasing rate, we see that the velocity vs. clock time graph curves
upward.
- How would we describe the shape of the
curve if the velocity was increasing at a decreasing rate?
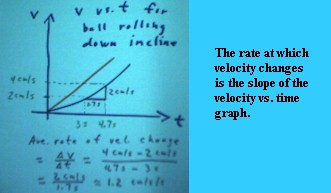
We previously saw that the average velocity
was the average rate at which position changes. We are now interested in the average
rate at which the velocity changes.
- Suppose that the velocity is 2
cm/sec at clock time 3 seconds, and 4 cm/sec at clock time 4.7 seconds.
Then the velocity has increased by `dv = 4 cm / sec - 2 cm / sec = 2 cm /
sec during a time interval of length `dt = 4.7 sec - 3 sec = 1.7 sec.
- Make note of the notation used
here. The symbol `d stands for the Greek letter 'delta'. In mathematics
and physics, this Greek letter almost always means 'change in. Thus,so `dv
means `delta v' which means 'change in v'. Similarly `dt means `delta t'
which means 'change in t'. We use the `d notation because because at
present not everyone has the appropriate font sets to interpret the
character in their browser. (See the first introductory problem set for the
shapes of the various Greek letters commonly used in this course).
http://youtu.be/DTV5kwe2odc
http://youtu.be/7V0H9nAcnck
http://youtu.be/Fyr2bQGr_Dk
The average
rate at which velocity changes is
therefore `dv / `dt = (2 cm / sec) / (1.7 sec) = 1.2 cm / sec / sec (approx.
The 'approx. indicates that the 1.2 is an approximate value of 2 / 1.7. You
should be sure to check all calculations done in these notes. Their accuracy is
not guaranteed.).
- As shown on the picture, `dv = 2
cm/sec corresponds to the 'rise'
between two graph points, and `dt = 1.7 sec to the 'run'
between those points, so `dv
/ `dt corresponds to rise / run = slope. This is a very important
idea.
- The needle on our speedometer would
change by 2 cm / sec in the 1.7 sec. between clock times 3 sec and 4 sec; so
in a sense we would say that the needle, whose position is measured in
cm/sec, is moving at a 'speed' of 1.2 cm/sec / sec. So the
'speed' of the speedometer needle is the rate at which the velocity changes.
For the straight-line
graph of v vs. t, the slope
is the same between any two points. This means that the average acceleration
between any two points is the same as between any two points. We therefore
conclude that acceleration is
constant, and call this a constant-acceleration graph.
- Most of the motion analyzed in an
introductory physics course is constant-acceleration motion, and is
therefore represented by a straight velocity vs. clock time graph.
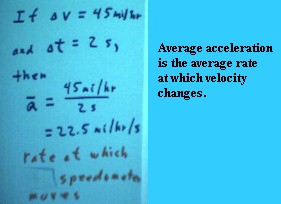
The figure below depicts our analysis of the
situation where a speedometer on a car (a pretty fast car, obviously) changes by
45 mi / hr in 2 seconds (visualize a speedometer doing that and imagine what it
would feel like to be riding in that car).
- We see that the average rate at
which the velocity changes is `dv / `dt = 45 mi / hr / (2 seconds) = 22.5
mi/hr / sec.
- We call this average rate the
'average acceleration'.
- Note that, as above, the Greek
letter Delta is used where we have used `d in the text.
- The line over the a is called a
'bar', and the a with the line over it is called 'a-bar'; the bar denotes an
average quantity. We will write 'a-bar' as 'aAve', but it will often be
represented in figures accompanying the text by the 'a-bar' notation.
http://youtu.be/UlOdP3yzBoo
The interestingly colored figure below shows
a velocity vs. clock time curve with some clock time, denoted t0, indicated on
the t axis. The goal is to find the acceleration
at the instant t = t0.
Note error: The first picture refers
erroneously about finding the velocity at t0. It should have said 'acceleration
at t0'.
http://youtu.be/krcl8IokZU4
We first note that the average acceleration
between two points is the slope of the segment between the points.
- We use the t0 point of the graph as
a fixed point, and we take a series
of graph points approaching t0.
- For each point we find the
corresponding slope to
represent the average
acceleration between the
two points.
- The 'slope triangles' for three of
these points (the last pretty close to t0 and hard to see) are depicted.
- The slopes of these triangles approach
the slope of the tangent line (the
dark brown line that just touches the curve at the t0 point).
- The slope of the tangent line is
therefore the limiting value of the acceleration, which we take to be the acceleration
at the instant t = t0.
Design and conduct an experiment using a
timer and a ball on a constant-incline ramp to
- Prove that when a ball rolls down
the ramp, its average velocity on the 'second', or lower, half of the ramp
is greater than on the initial half.
- Determine as closely as possible the
ratio of the average velocity on the lower half to that on the initial half.
Do the following, and retain a copy for your
own future reference. Suggested titles: 'yymmdd'_experiment_**** and 'yymmdd'_questions_****,
where 'yymmdd' consists of the last two digits of the year (yy) followed by the
two-digit month mm (01, 02, ..., 12 for Jan thru Dec.) and dd the day of the
month (01, 02, ... ). If on a pre-Windows 95 system, try 'yymmddex' and 'yymmddqu'.
- E-mail a description of your
experiment and your results.
- E-mail your answers to the questions
posed at the beginning of these notes.
What does the graph of position vs. clock
time look like for constant-acceleration motion?
How can we obtain a graph of velocity vs.
clock time from a position vs. clock time graph?
How can we obtain a graph of position vs.
clock time from a velocity vs. clock time graph?
How can we obtain a graph of acceleration
vs. clock time from a velocity vs. clock time graph?
How can we obtain a graph of velocity vs.
clock time from an acceleration vs. clock time graph
"