"
Physics I Class Notes, 8/26/98
Finding Change of position
from velocity vs. time information; graphical representation by trapezoids
Position vs.
Clock Time for uniform acceleration
Position vs. Clock Time graph
Introduction, Goals and Questions
Here we reason out a variety of questions regarding the changes in
position that can be inferred from velocity vs. clock time information. We do
this first within the context of known initial velocity, a known constant rate
of velocity change, and a given time duration. We then consider position
changes over a number of relatively short time intervals, and construct a
position vs. clock time table and graph.
Today we:
- reason out changes in position from velocity vs. clock time
information
- use trapezoids to visualize position change from initial and
final velocity and time duration
- translate a graph of velocity vs. clock time into a table or
graph of position vs. clock time.
Our starting example gives us the initial velocity, time duration and
constant rate at which the velocity of an object changes. This example leads to
the following questions:
- Given the constant rate at which velocity changes, initial
velocity, and time duration, how do we reason out the corresponding change
in the position of an object?
- How do we determine position changes over specified time
intervals from a graph of velocity vs. clock time, and how can we then
construct a graph of position vs. clock time?
- In terms of the meanings of altitudes, area and width, how does a
velocity vs. clock time trapezoid represent change in position?
- How can a series of velocity vs. clock time trapezoids help us to
calculate and visualize position vs. clock time information?
You will be asked to use the shape of the position vs. clock time graph
to explain how to visualize the results of your experiment from the preceding
class.
Finding Change of position from velocity
vs. time information; graphical representation by trapezoids
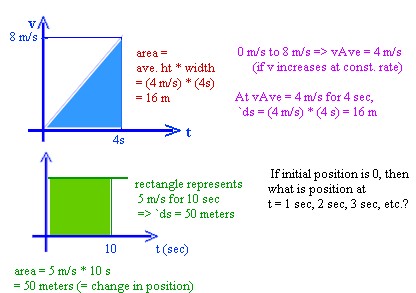
Suppose that the velocity of an object
increases at a constant rate from 0 to 8 m/s in 4 seconds. How are we to find
the distance it travels in the 4 seconds?
- Rather than distance traveled, we
will use the term position
change. Position change can tell us more than distance, since we
can define position change in such a way that it is positive
or negative, whereas distance is always positive.
- We know that if the velocity is constant (e.g.,
if velocity is 5 m/s as in the green graph below) the position change is
equal to the product of
velocity and time duration (e.g.,
at 5 m/s for 10 seconds the position change is 5 m/s * 10 s = 50 m).
- The green graph shows how this
calculation can be represented as the area of a rectangle with altitude 5
meters and width 10 seconds.
A graph of the changing-velocity situation
shows velocity increasing along a straight line (i.e., at a constant rate) from
0 to 8 m/s in 4 seconds.
- We can reason out the corresponding
position change by noting that the average velocity seems to be 4 m/s
(averaging 8 m/s and 0 m/s), so that in 4 seconds the position change is `ds
= 4 m/s * 4 s = 16 meters.
- Can we calculate this position
change as an area, as we did with the constant-velocity situation of the
green graph?
To calculate the area
of the trapezoid under the graph (yes,
it's a triangle, but a triangle is a trapezoid with one side equal to 0) we can
multiply its average height times its width.
- The average
height of a trapezoid is
just the average of its
heights, which are 0 m/s and 8 m/s. So the average height of the
trapezoid below is 4 m/s.
- Multiplying average height
by width we multiply the
4 m/s average height,
which represents average
velocity, by the 4-second width,
which represents time
interval, we get area (4
m/s) * (4 sec) = 16 meters, which represents the position
change.
We see that the two ways of calculating
position change correspond exactly. The reason is fairly obvious: the average
height corresponds to the average velocity, since in either case we are
averaging the initial and final velocities, while the average width corresponds
to the time interval by which we multiply the average velocity.

http://youtu.be/w5KnFHXzuNI
http://youtu.be/vT88EpAYGXM
http://youtu.be/sqxNbW0guFc
We now wish to determine the position
at clock times t = 1, 2 and 3 seconds, assuming that the initial
position is zero. Since the position has changed by 16 m during the 4 seconds,
we first conclude that at t = 4 seconds the position is s = 16 meters (we use s
to denote position).
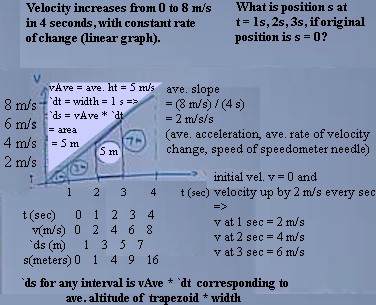
The bad-looking graph below shows the
velocity vs. clock time line.
- If we accept that change of position
is represented by the area under the velocity vs. clock time graph, we can
determine the velocities at 1, 2 and 3 seconds using similar triangles(e.g.,
if the trapezoid whose base goes from 0 to 4 seconds has final altitude 8
m/s, then the triangle with base from 0 to 1 second has final altitude 1/4(
8 m/s) = 2 m/s).
- Alternatively we can use the concept
of acceleration: since velocity increases at a constant rate of 2 m/s/s
(determined by the slope of the graph and corresponding to, for example, the
speed of the speedometer needle), and since initial velocity is 0, the
velocity goes up by 2 m/s every second and reaches 2 m/s after 1 sec, 4 m/s
after 2 sec, 6 m/s after 3 sec.
Using the velocities we obtain, we can for
any time interval determine the average velocity over that interval.
- For example, between 2 and 3 seconds
the velocity increases from 4 m/s to 6 m/s. The average
velocity is therefore 5
m/s, corresponding to the altitude
of the indicated trapezoid.
- Since this average velocity has a
duration of 1 second, the position
change during that
second is (5 m/s) * (1 sec) = 5 meters.
The position
changes during the time
intervals are 1 m, 3 m, 5 m and 7 m, and are indicated by the circled
numbers on the graph.
- The total position change up to a
given clock time is easily found by adding the position changes during all
the time intervals up to that clock time.

Note: The following series of video clips is repeated on the notes for
the next class. They are related to the above calculations; they are directly
related to the calculations in the subsequent set of notes.
http://youtu.be/IHT2YlutZL8
http://youtu.be/_AaGoFJMy1U
http://youtu.be/rdyjcU6-uD0
http://youtu.be/s4Q-awKu2EY
http://youtu.be/hGJQpRV6TQQ
http://youtu.be/mBviyN74Igk
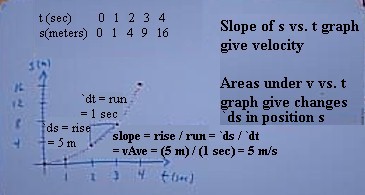
If we plot position s vs. clock time t we
obtain the graph shown below.
- We note that if the slope is
calculated between two points of this graph, we obtain the average
velocity between the
corresponding clock times. We might conjecture that the slope of a position
vs. clock time graph represents average velocity.
- This graph of area
under the velocity graph vs. clock time has slopes which
give us back our average
velocities.
We have started with a velocity vs. time
graph, used its areas to obtain a position vs. time graph and used the slopes of
this position vs. time graph to get back to the velocities we started with.
- Present, past and future calculus
students, and especially Physics 241 students, note: This full circle is
the essence of the Fundamental
Theorem of Calculus.

From your previous experiment, you know that the
average velocity of an object rolling down a uniform incline is greater on the
lower than on the upper half of the incline.
- How does the shape
of the corresponding position vs. clock time graph, with its upward
curvature, show us that the time required to travel the first half of the
incline is greater than that required to travel the second half?
Distance Students
Do the following:
- E-mail a description of your answers
to the experiment question.
- E-mail your answers to the questions
posed at the beginning of these notes.
Further questions:
What would happen to our position vs. clock
time graph if the position at t = 0 wasn't zero?
How are the velocity vs. time and
acceleration vs. time graphs related?
How can we look at a graph of velocity vs.
time and visualize a corresponding position vs. time or acceleration vs. time
graph?
How can we look at a graph of position vs.
time and visualize the velocity vs. time graph?
How can we look at a graph of acceleration
vs. time and visualize a corresponding velocity vs. time graph?
"
