"
Physics I Class Notes 9/11/98
Force and Acceleration
We consider the results of the experiment from the previous class, attempting to
determine whether acceleration on a constant incline seems to be constant. We then
review and analyze the experiment which relates the force accelerating a friction car down
and incline to the to the slope, then the acceleration of the car to the slope, and
finally infer the relationship between force and acceleration.
Introduction, Goals and Questions
We see that
- the force accelerating the car down the slope is a linear function of the slope, for
small slopes
acceleration is a linear function of slope, for small slopes
force is therefore a linear function of acceleration
force is very nearly proportional to acceleration
and we conclude tentatively that
- the slope of the acceleration vs. slope graph is close to, and perhaps within
experimental error equal to, the acceleration of gravity.
The following questions arise:
- What is the meaning of the x intercept of the graph of force vs. slope?
What is the meaning of the x intercept of the graph of acceleration vs. slope?
When we obtain a linear relationship between force and acceleration, is it plausible
that the constant term in the equation is, within experimental uncertainty, zero?
For the force vs. acceleration relationship for the car, why should we expect that the
acceleration corresponding to a force equal to the car's weight is the acceleration of
gravity?
Results of
Experiment: Constancy of Average Velocity on a Uniform Slope
The graph below shows the average acceleration of a low-friction cart over
distances of 5, 10, 15, …, 95, 100 cm.
- The cart was timed as it coasted from rest over each distance, and the acceleration was
inferred from this information.
Timing was accurate to within .03 sec.
Does the data seem to indicate, within the limits of the
errors inherent in the experiment, that acceleration is the same
on a constant incline regardless of where the cart is or
how fast it is going? Answer this question as completely as
possible, to the best of your ability.

Experiment:
Force and Acceleration for a Cart on an Incline
http://youtu.be/q3UCL3Kp0CU
http://youtu.be/V-FIWMO8Es0
http://youtu.be/ngQkUbUw9i0
http://youtu.be/IsKWUI832-E
http://youtu.be/YC-uMBu97No
http://youtu.be/UD6LA6YQG90
http://youtu.be/GeVkQ5vhC7U
We conduct the following experiment (distance students: this experiment is part
of your assignment):
- We use the spring balance, the rubber band balance or other force-measuring device
attached to the cart to measure the force, in Newtons, required to hold
the cart back on a variety of different slopes between .03 and
.15.
- We use the level and ruler to measure the slope.
- While we are at it, we time the cart for a known distance down the
ramp, starting from rest, so we can later determine its acceleration
for each slope.
We graph force vs. slope and determine graph slope.
- If your graph extended for a ‘run’ of 1, what would be the ‘rise’
in Newtons?
Using an appropriate balance, we weigh the cart, suspending it like a
fish being weighed.
- Is the result close to the ‘rise’ obtained from a run of 1?
We calculate the acceleration for each slope.
- Calculate acceleration from your timing of the cart from rest through
a known distance.
If we assume that the net force that accelerates the cart down the
incline is equal to the resisting force you measured with the balance,
then we might plot the force on the cart vs. its acceleration.
- Make this assumption, or at least pretend to make it, and plot the specified graph.
- What is the slope of the graph in m/s^2 / N?
Discuss:
- Where does the force that accelerates the cart come from?
- List all the forces that act on the cart, and discuss how they affect its
motion.
Results:
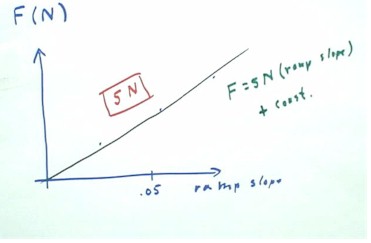
- The force vs. slope results
obtained by one group consisted of three data points lying reasonably close
to a straight line.
- The slope of the line was
very close to 5 Newtons.
- It turns out that the weight
of the cart is very nearly 5 Newtons also.
As we will see later, the slope
of the graph should equal the weight of the cart.

http://youtu.be/rxBa6tonA0A
The acceleration of the same cart was measured over a
variety of slopes.
- Acceleration was determined by timing the cart as it accelerated from
rest for a distance of 43 cm.
The observed median time intervals required for the cart to accelerate
from rest through this distance were as follows:
- 3.33 seconds on a slope of .021,
- 1.97 seconds on a slope of .044,
and
- 1.44 seconds on a slope of .074.
From these observations it was determined (and these figures should be checked by anyone
who wasn't present) that the accelerations were
- .076 m/s/s on the first slope, .
- 219 m/s/s on the second slope and
.
- 393 m/s/s on the third slope.
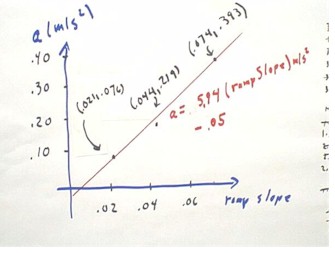
A graph of acceleration vs. slope is depicted below.
- Using DERIVE to find the best-fit
straight line, we obtain a = 5.94 m/s/s * rampSlope - .05 m/s/s.
- This result is in very poor
agreement with the expected result, which should give a slope of 9.8 m/s/s rather
than 5.94 m/s/s.
The poor agreement is probably due to the fact that the individuals
calculating the slope used the 43 cm distance over which the cart
coasted, rather than the 61 cm distance over which the slope was measured,
as a basis for determining the slope of the incline.
- The reader should check to
see that, if this is the case, the correct ramp slopes would be 43
/ 61 of the incorrectly calculated slopes, that
- this would result in a graph slope
that is 61 / 43 times as great as that obtained, and that
- the graph slope would therefore be
nearly 9 m / s / s.
This is still not in spectacular
agreement with accurately determined values, but it is a great improvement over the
previously obtained values.

http://youtu.be/vp5OqIeY3a4
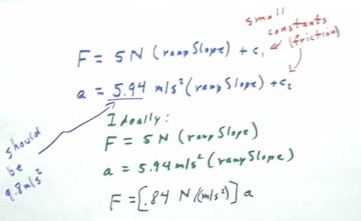
A summary of our results to this point shows that the net force on the cart is given by
and that the acceleration of the cart is given by
- a = 5.94 m/s^2 * (rampSlope) + c2, or, if we accept the correction for
incorrect slope,
a = 9 m/s^2 * (rampSlope) + c2,
where c1 and c2 are relatively small numbers, possibly positive and
possibly negative (think about which is more likely), which arise mainly because of the small
amount of friction in the wheels of the cart.
- In an ideal frictionless situation, if everything was measured with absolute
precision, the constants c1 and c2 would both be zero.
As we have seen before, friction will have no significant effect on
the slopes of such graphs, as long as the slope is small.
We therefore omit the constants c1 and c2 and conclude that according
to our data, in the ideal no-friction case, we would have
- F = 5 N * rampSlope and
- a = 5.94 m/s^2 * rampSlope.
If we solve the second equation for rampSlope and substitute
the result in the first equation we obtain
The reader should repeat this solution using the a = 9 m/s^2 * rampSlope, and also
using the well-established relationship a = 9.8 m/s^2 * rampSlope.

http://youtu.be/jtGfrN-GuLI
We can obtain the force vs. acceleration relationship directly by making a table
of force and acceleration vs. ramp slope, and simply graphing
force vs. acceleration.
Make such a graph and determine its slope.
From the first experiment, we conclude that
- within limits of experimental error, the acceleration of a friction cart on a
slope appears to be independent of velocity or position
We can conclude that, for small slopes:
- in the absence of friction, the acceleration of an object down an incline would
be equal to the acceleration of gravity multiplied by the slope
- in the absence of friction, the force accelerating an object down an incline
would be equal to the weight of the object multiplied by the slope.
"
