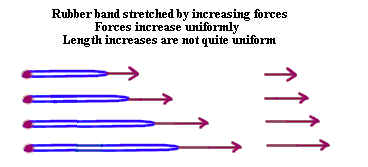
Increasing forces exerted on a rubber band will result in an increasing rubber band
length (the harder you pull the more the rubber band stretches).
- The figure below uses arrows to indicate the vectors representing the forced applied to
the rubber band.
- The force vectors are indicated as they act on the end of the rubber band.
- The same force vectors are again indicated at the right of the figure, where they are
aligned in order to show their relative magnitudes.
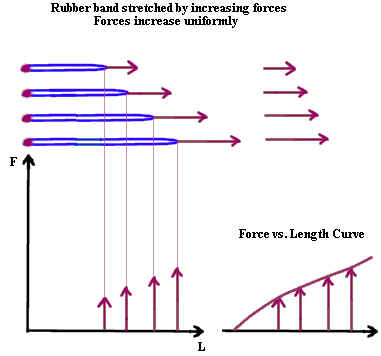
The previous figure is repeated. A force vs. length graph is constructed from the
figure.
- The length of the rubber band when subject to each force is projected downward to the L
axis of the graph.
- The force vector corresponding to each length is turned to the vertical direction, to
match the direction of the F axis, and positioned at the appropriate length coordinate L.
- The graph at lower right shows the force vs. length curve for the rubber band.
This curve would be useful for estimating the force at a length different than one
of the four given lengths.
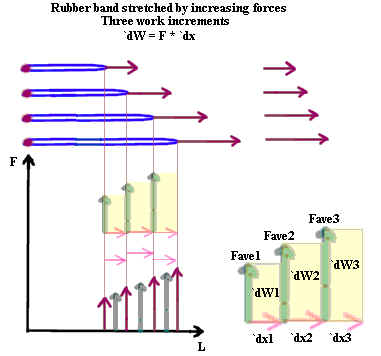
For each interval of length there is an average force. When this average force is
multiplied by the distance through which it acts we get the work required to exert the
force through that distance.
- In the figure below there are three distance increments (the first distance increment is
between the first and second length, and the other two are between the second and third
length, and between the third and fourth length). These increments correspond to the
three intervals on the F vs. L graph.
- The changes in length of the three increments are indicated by the pink vectors on the
graph. Each of these vectors runs from one rubber band length to the next.
Thus there is one change-in-length vector for each ot the three length intervals.
- In the middle of each length interval on the graph we have constructed a vertical vector
whose length is equal to the average force exerted on that interval. This average
lies between the force exerted at the left endpoint of the interval, where the minimum
force on that interval is exerted, and the force exerted at the right endpoint, where the
maximum force on the interval is experienced.
- Directly above the F vs. L graph the `dx vector and the Fave vector are depicted for
each interval. For each interval the lightly shaded area is a rectangle with
dimensions Fave by `dx, so the area of the rectangle represents the product Fave `dx for
that interval.
- This figure is enlarged and labeled at the lower right-hand corner of the figure.
The distances `dx1, `dx2 and `dx3 are the changes in rubber band length for the
three respective intervals. The average forces Fave1, Fave2 and Fave3 are the
average forces. The areas `dW1, `dW2 and `dW3 represent the Fave * `dx products for
the three intervals, and represent the work done in stretching the rubber band through the
length of the interval.
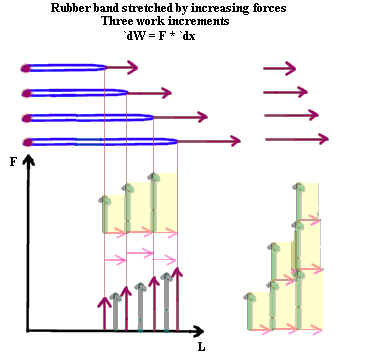
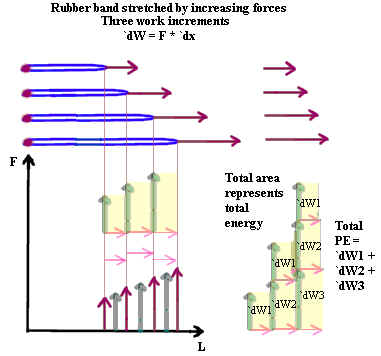
The figure below is identical to the figure above, except that the figure at lower
right now represents the total work done, starting at the first rubber band length shown,
through the end of each interval.
- At lower right, above the first interval we see only the rectangle representing the work
done on that interval.
- Directly above the second interval we see the work done on that interval, and 'stacked'
on top of that work we see the rectangle representing the work done on the first interval.
The total of the two areas represents the total work required to stretch the rubber band
from its initial length through the second interval.
- Directly above the third interval we see the rectangle representing the work done on the
first interval, and above this rectangle we see rectangles representing the work done on
the second and third intervals. These three rectangles represent the work done
through the end of the third interval.
Since the stretched rubber band has the ability to do work, we say that it stores
potential energy.
- At the end of any interval, if the rubber band is allowed to 'snap' back to its position
at the beginning of that interval then the rubber band will exert average force Fave
through a distance `dx and will therefore do work Fave * `dx on whatever it might be
pulling.
- The rubber band is therefore capable of doing work `dW1 as it 'snaps' back through
interval 1, and work `dW2 and `dW3 as it 'snaps' back through intervals 2 and 3.
- If the rubber band is extended to the greatest length shown in the figure, then as it
'snaps' back to the first length shown it will do work `dW1 + `dW2 + `dW3. We
therefore say that at its longest position it has total potential energy `dW1 + `dW2 +
`dW3. This is illustrated at lower right in the figure below.
- At the second-longest position the rubber band has total potential energy `dW1 + `dW2.
It can perform this much work as it 'snaps' back from this position to the first
position.
The potential energy at each position is represented by the total area up through that
position.
The figure below shows how kinetic and potential energy are exchanged as the rubber
band, now attached to a mass, snaps back
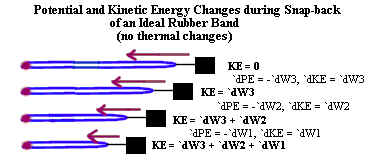
Note that everything said here is for an 'ideal' rubber band. In the real world
rubber bands change temperature as they are stretched and as they snap back. This
temperature change involves energy and somewhat changes the energy relationships as give
here.