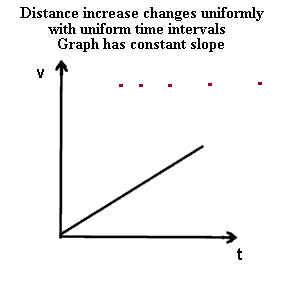
The first graph below depicts a series of dots indicating the position of an object at
equal time intervals. We see that the object travels further with each time
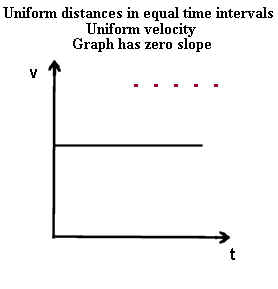
interval. The dots in the second graph are separated by the same distance,
representing motion at an unchanging velocity.
- The dots in the first graph represent an object whose velocity increases by the same
amount during each of the equal time intervals. The velocity of this object is said
to be increasing at a uniform rate, and the graph of velocity v vs. clock time t for this
object will be a straight line sloping upward as we follow the graph from left to right.
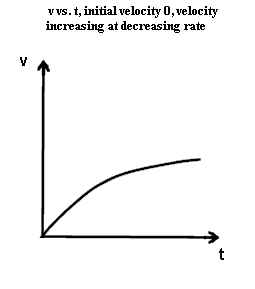
- The first graph is represented as having initial velocity 0--i.e., v = 0 when t = 0.
However this will only be the case if the clock which measures t is started at the
same instant the velocity of the object is zero. If the clock is started at a later
time the velocity at t = 0 might be different. This would result in a raised graph,
but if the graph represents the same object it will have the same slope.
- The velocity of the object represented by the second graph is unchanging and since the
object's position keeps changing the velocity will not be zero. If we assume that
the object is moving in the positive direction the graph must represent positive velocity
and must run in the horizontal direction somewhere above the t axis.
Acceleration need not increase as velocity increases.
- In the first graph we see that the velocity continues to increase and that initially the
velocity changes quickly. By the halfway point between left and right the velocity
is already close to its maximum.
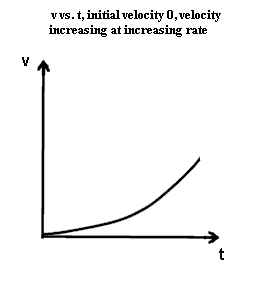
- In the second graph we see that the velocity continues to increase but that initially
the velocity changes slowly. By the halfway point between left and right the
velocity is nowhere near halfway to its maximum; most of the velocity change takes place
in the right half of the graph.
- The steepness of the second graph continues to decrease as we move from left to right,
indicating an increasing rate of velocity change. Though velocity is increasing, the
rate of increase, or the acceleration, decreases.
- The steepness of the second graph continues to increase as we move from left to right,
indicating an increasing rate of velocity change. In this case velocity is
increasing while the rate of increase, or the acceleration, also increases.
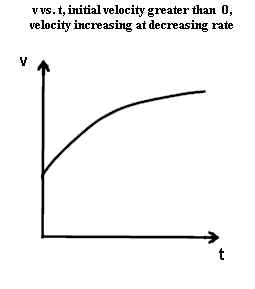
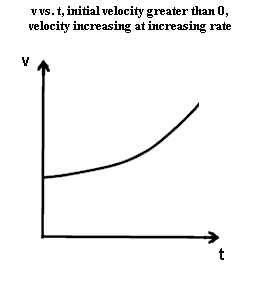
Initial velocity may be zero or nonzero without affecting acceleration *&
- The two graphs below are identical to the two preceding graphs except that initial
velocity, which was zero in the preceding graphs, is now nonzero.
- The steepness of each graph is identical for any given clock time t to the steepness of
the corresponding graph in the preceding pair.
- At every clock time t the velocity indicated here for each graph is greater than the
velocity in the corresponding graph of the preceding pair.
- These graphs therefore represent motion at greater velocity, but with the same
acceleration, as the corresponding graphs of the preceding pair.
The two graphs below represent velocities which change at a constant rate, in one case
with zero initial velocity and in the other with nonzero initial velocity.
- In both graphs the slope is constant so the rate of velocity change, or acceleration, is
constant, or uniform.
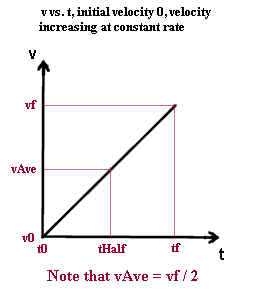
- The first graph depicts uniformly accelerating motion beginning with intial velocity
zero. v0 stands for the initial velocity and vf for the final velocity. t0
stands for the initial clock time and tf for the final clock time. vAve stands for
the average velocity and tHalf for the time halfway between t0 and tf.
We see that since the graph is straight vAve must be exactly halfway between v0 and vf,
and must also occur at clock time tHalf. Since v0 = 0 this means that vAve must be
exactly half of vf.
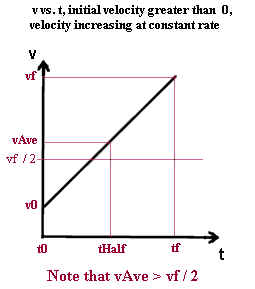
- The second graph depicts uniformly accelerating motion beginning with intial velocity
greater than zero. v0 stands for the initial velocity and vf for the final velocity.
t0 stands for the initial clock time and tf for the final clock time. vAve
stands for the average velocity and tHalf for the time halfway between t0 and tf.
As before, since the graph is straight vAve must be exactly halfway between v0 and vf,
and must also occur at clock time tHalf.
However half the final velocity, denoted vf / 2, is halfway between velocity 0 and
velocity vf. It must therefore be less than vAve.
Since v0 is not 0 we see that vAve cannot be exactly half of vf.
When acceleration is uniform and initial velocity is zero, average velocity will be
exactly half of final velocity.
When acceleration is uniform and initial velocity not is zero, average
velocity will not be exactly half of final velocity.