The figures below illustrate how the rate at which the velocity of a constant mass
changes depends on how much force is exerted on it.
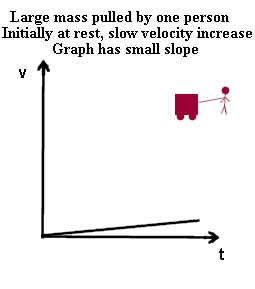
- When a moderate mass is pulled with a small force its velocity changes slowly.
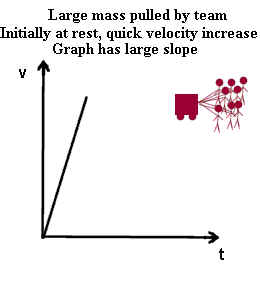
- When a moderate mass is pulled with a large force its velocity changes quickly.
The rate at which the velocity changes is easily seen on a v vs. t graph. The
quicker the change in the velocity the steeper the graph.
The rate at which velocity changes is the acceleration. The acceleration in the
second situation is greater, where more net force is exerted on the same mass. The
acceleration is represented by the slope of the v vs. t graph.
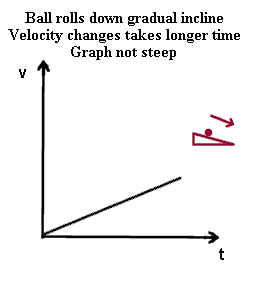
A ball rolling down an incline after being released from rest will speed up more
quickly if the incline is greater. The ball on the lesser incline speeds up less
rapidly than the ball on the greater incline.
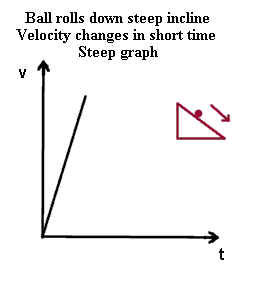
- The v vs. t graph is steeper for the greater incline, indicating how velocity changes
more in a shorter time than on the more gradual incline.
- The arrows in the pictures indicate only the direction of motion.
On the greater incline the ball experiences greater net force down the incline.
This will be familiar to you if you have ever tried to hold back a rolling object on an
incline--it's more difficult on the greater incline.
The rate at which velocity changes is the acceleration. The acceleration in the
second situation is greater, where more net force is exerted on the same mass. The
acceleration is represented by the slope of the v vs. t graph.
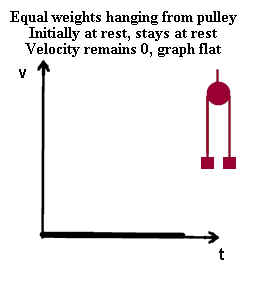
When equal masses hang from a pulley, we may consider the two masses and the rope
connecting them to be a system. The force of gravity on one mass tends to pull the
system in one direction and the force of gravity on the other mass tends to pull the
system in the other direction.
- When the masses are equal the net force on the two masses is therefore zero.
- In this case if the system is initially rest it remains at rest. If the masses are
just hanging there that's what they keep doing.
Note that if the system was initially moving in one direction or the other, perhaps as
the result of a recent pull exerted by a bystander on one mass or the other, then the
system would continue moving for a time.
- If initially in motion and if not interfered with the system will continue in motion
either until friction has brought it to a stop, until one of the masses reaches the
pulley, or until one of the masses strikes the ground.
- In any case friction will continually slow the system as long as it is moving.
- If friction happens to be small, as in the case of a well-lubricated pulley running on
good bearings, the slowing will be very gradual and might not even be easily measurable.
- In the ideal case of no friction the system will continue moving at a constant velocity
until one of the masses hits either the ground or the other pulley.
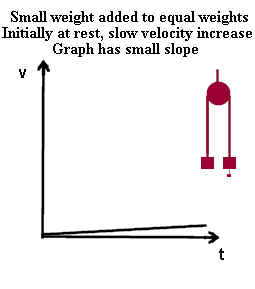
If a small mass is attached to one of the equal masses of the preceding figure then, if
we consider the pulley to have negligible friction, the system will gradually speed up.
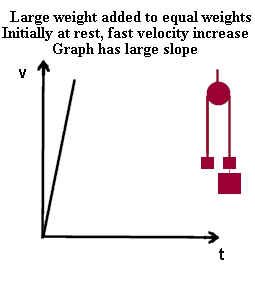
If a large mass is attached to one of the equal masses the system will also speed
up, but much more rapidly than in the case of the small attached mass.
- The figures below illustrate the v vs. t graphs for the cases of small and large
attached masses.
- The small rate of change of velocity for the case of the small additional mass is
illustrated by the small slope of the v vs. t graph.
- The larger rate of change of velocity for the case of the large additional mass is
illustrated by the steep slope of the v vs. t graph.
- In both cases the slope of the graph represents the rate of change of velocity, or the
acceleration, of the system.
- In both cases, if the frictional force is negligible, the net force on the system will
be equal to the force of gravity on the added mass. Since the added mass is assumed
to be constant, the net force on the system will also be constant. The result of a
constant net force will be a constant acceleration; hence the velocity vs. time graphs
will form straight lines.
It is worth noting that no matter how large the attached mass, the acceleration of the
system will never exceed the acceleration of gravity. This is so since the attached
mass itself, if attached to nothing else, would accelerate at this rate. Attaching
it to a system can only reduce the acceleration of a freely falling object.
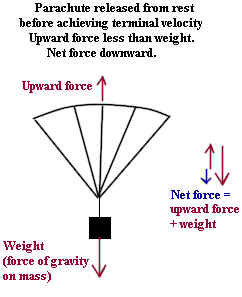
The figure below illustrates the forces on a parachute supporting a mass shortly after
the system is released from rest. The system has not yet reached its maximum speed,
so it is still speeding up. This means that the upward force (the force of air
resistance) is not as great as the downward force exerted by gravity on the system.
- The upward force is represented by the red upward arrow.
- The downward force is represented by the downward arrow, which is longer to represent
the fact that it is in this case the greater force.
- The vector diagram at right shows how when the upward force vector is added to the
downward force vector the resulting force, represented by the blue arrow, is the net force
on the system.
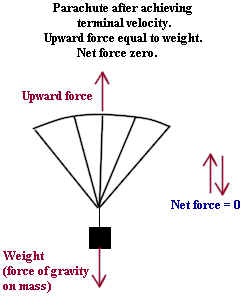
The figure below shows the parachute after achieving its maximum, or terminal,
velocity.
- The upward force of air resistance has increased so that it is equal in magnitude to the
force exerted by gravity.
- Since the upward force is equal and opposite to the force of gravity the net force is
now zero.
- Since the net force is zero the system will have zero acceleration, which implies
constant velocity.
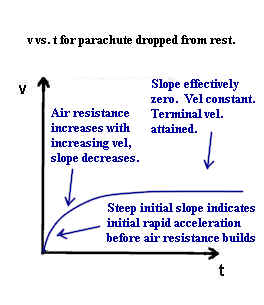
The figure below shows the v vs. t graph for the parachute.
- Initially the parachute is moving slowly and there is little upward force, so the net
force is nearly equal to the weight and the acceleration is close to the acceleration of
gravity..
- As velocity builds the upward force increases and the net force on the system decreases,
resulting in a decrease in acceleration. This is represented by the decreasing slope
of the graph.
- After a time the upward force will be effectively equal and opposite to the force of
gravity and the velocity of the system will be constant. This is indicated by a
horizontal graph, with zero slope.
Acceleration is the rate at which velocity changes.
- This rate is (change in velocity) / (change in clock time).
- Between any two points of a v vs. t graph change in velocity will be the rise and change
in clock time will be the run.
So slope = rise / run is equal to (change in velocity) / (change in clock time), which
is the rate of velocity change or the acceleration.
A constant net force on a constant mass will result in a velocity which changes at a
uniform rate.
- The rate of velocity change is represented by the slope of the v vs. t graph. So
if a constant net force acts on a constant mass then the graph of velocity v vs. clock
time t must be a straight line.
- Acceleration is the rate at which velocity changes. So a constant net force acting
on a constant mass results in a uniform acceleration.
*&*& atwood no friction equal masses, rope a bungee cord; masses alternately
hit the ground. How far does the system travel if given infinite time?