The following experiment was conducted, after making predictions about the behavior of the system:
The following predictions were made
Despite several attempts to siphon, lose and abuse the water most groups collected about 100 ml of water at the 30 cm altitude, very close to predictions.
The assignment was given to do as complete a thermodynamic analysis as possible of this process, assuming that the gas in the bottle is diatomic.
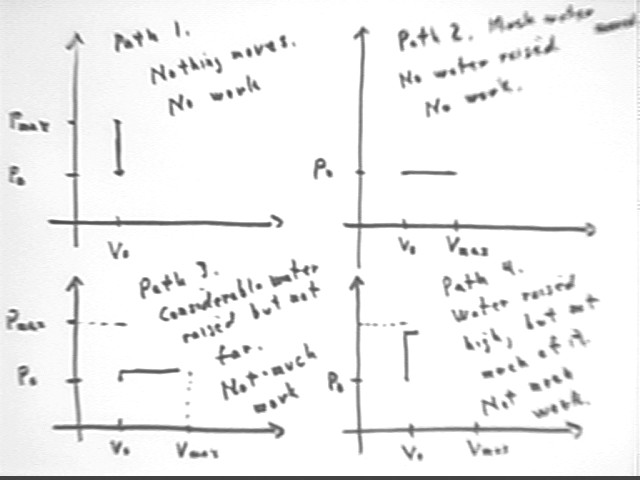
The diagrams below depict several possible paths for a system originating at pressure P0 and volume V0. There is a maximum possible pressure and a maximum possible volume, depending on P0, V0 and on the original and final temperatures T0 and Tmax.
To achieve Pmax we would follow path 1, in which the constant volume implies that nothing moves so no work is done. This corresponds to heating the system of our experiment while letting the water continue to rise in a thin tube (thin enough that its volume is negligible) until temperature is Tmax.
To achieve Vmax we would follow path 2, in which the constant pressure implies that water doesn't rist in the tube so there is no PE increase and no mechanical work is done. This corresponds to heating the system of our experiment while the water displaced by the expanding gas is allowed to flow into another container at the same level as the water.
Path 3 depicts a system in which the water is permitted to rise a little in the tube, necessitating a small pressure rise and corresponding temperature rise, before flowing out at the slightly higher level. Since the expansion starts at a higher temperature than along path 2, while reaching the same maximum temperature Tmax, the gas will not be able to expand as much and not quite as much water will be displaced.
Path 4 depicts a system in which the water rises to near its maximum possible level, requiring pressure near Pmax and a temperature near Tmax, before being allowed to flow out. Since temperature will at that point be near Tmax, not much expansion will be possible and not much water will be displaced. So despite the greater altitude change the PE change will again be small.
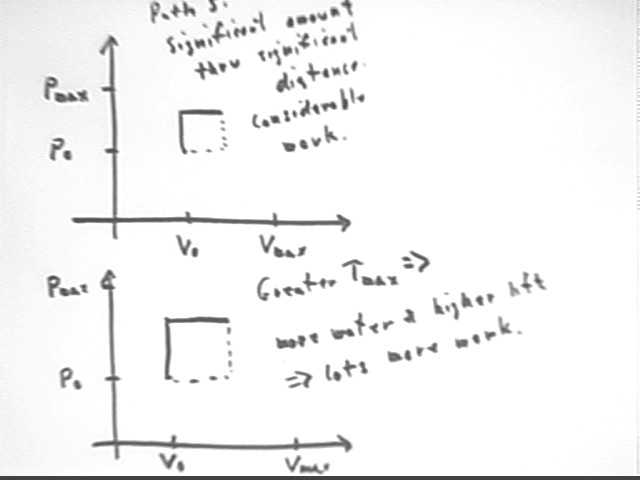
The figure below shows at top an intermediate path, where water is allowed to rise significantly, more or less halfway to the maximum possible height, bringing temperature more or less halfway from T0 to Tmax, before being allowed to flow out at that height. Significant temperature change will occur and hence significant water volume will be displaced, resulting in much more PE increase than along Paths 3 and 4.
The lower graph in the figure below shows what happens if Tmax is increased, allowing greater Pmax and Vmax. Note how both altitude and volume expansion will be increased, each resulting in more work to achieve much more work than in the previous case. If the temperature rise is doubled, for example, altitude and volume expansion would both be doubled, resulting in 4 times as much work from only double the thermal energy transfer. From this we see that efficiency will increase much more rapidly than max temperature.
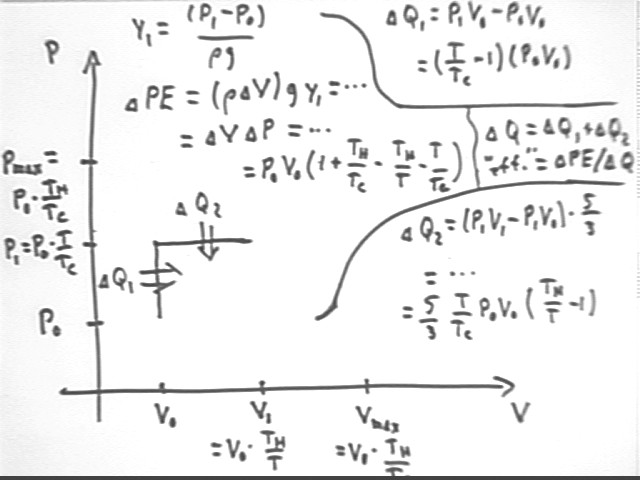
The figure below shows P vs V for a system with initial pressure and volume P0 and V0, max temperature Th and initial temperature Tc. We assume that water is allowed to rise to a height requiring gas temperature T, before being allowed to flow out of the tube. We observe that
m g y1 = density * volume of displaced water * g * y1 =
rho `dV * g y1 =
(V1 - V0) * rho g y1 =
`dV * `dP =
(V0 * Th / T - V0) * (P0 * T / Tc - P0) =
V0 * P0 ( Th / T - 1) ( T / Tc - 1) =
V0 P0 * ( 1 + Th / Tc - Th / T - T / Tc).
Recall that the internal KE of the molecules is difference *&*&
When you have completed the entire assignment run the Query program.