NOTE WILL BE COMPLETED AS SOON AS POSSIBLE
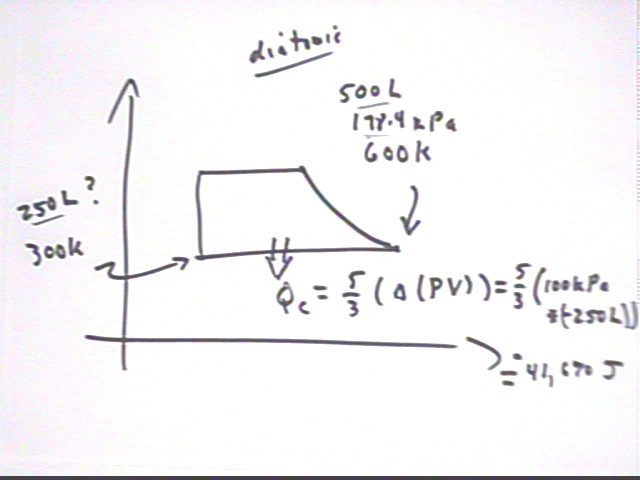
If the 500 liters of diatomic gas at 600 K and atmospheric pressure, from the situation analyzed last time, is cooled back to its original temperature without changing the pressure of the system how much energy must be taken from the system?
Note that the solution to this question is posted as part of the notes from the 02/03 class.
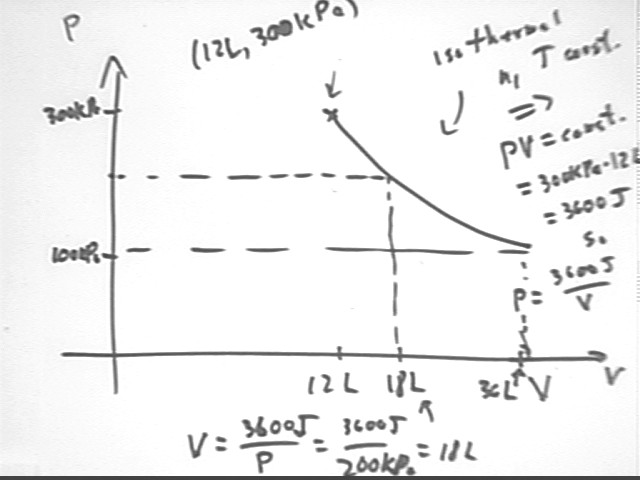
Suppose we have 12 liters of a gas at pressure 300 kPa, and want to allow the gas to expand isothermally until its pressure is reduced to 100 kPa. What are the coordinates of the points on the P vs. V graph for pressures 300 kPa, 200 kPa and 100 kPa?
Since T is held constant and the system is closed, P V = n R T tells us that P V is constant so
Knowing the P = 300 kPa when V = 12 liters we see that P V = 12 L * 300 kPa = 3600 J. Thus P V = constant = 3600 J and
If P = 200 kPa it follows that V = 3600 J / (200 kPa) = 18 liters, and if P = 100 kPa we have V = 3600 J / (100 kPa) = 36 liters.
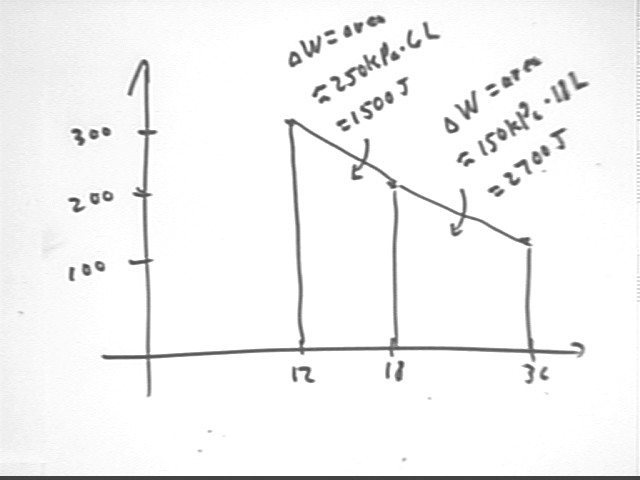
Estimate the area under the curve of the graph you constructed and give your best estimate of the work done in the expansion. How much thermal energy do you think will have to be added to the system during the expansion in order to maintain constant temperature?
Using the P vs. V information just obtained we construct the graph below. The area beneath the curve is approximated by the two trapezoids. In each case area = ave altitude * width. We obtain areas 1500 J and 2700 J, for a total area of 4200 J. This indicates that approximately 4200 J of energy must be supplied to maintain the system at constant temperature during the thermal expansion.
Note that the internal KE of the system does not change; this approximately 4200 J of energy does the work of the expansion.
Note also that the trapezoidal approximation actually lies a bit above the curve defined by P = 3600 J / V so that the trapezoidal approximation is a bit high.
Calculus interlude: The precise area is obtained by integrating the function P = 3600 J / V with respect to V, from V = 12 liters to V = 36 liters. Our antiderivative is 3600 J ln | V | and the integral is 3600 J ln | 36 liters | - 3600 J ln | 12 liters | = 3600 J ln | 36 liters / (12 liters) | = 3600 J ln | 3 | = 3955 J.
This result confirms that the trapezoidal approximation was a bit high.
In an adiabatic process the gas expands without any exchange of thermal energy with the environment. This is generally the result of a process that occurs so quickly that time permits only negligible energy exchange. We have seen that expansion of a gas is associated with a certain amount of work being done by the system. If an expansion is adiabatic, where does the work required for the expansion come from?
If the work required to expand a gas comes from the internal KE of its molecules, then what happens to the temperature of the gas as it expands?
In an adiabatic expansion how many of the variables P, V, n and T are changing and how does this complicate the analysis of the expansion and the construction of a P vs. V graph?
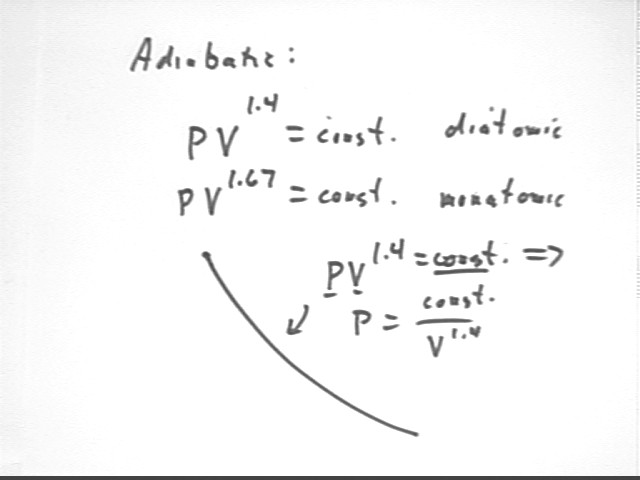
An adiabatic expansion of a diatomic gas is characterized by P V^1.4 = constant. Analyze the entire cycle of this system, assuming a diatomic gas and an adiabatic expansion.
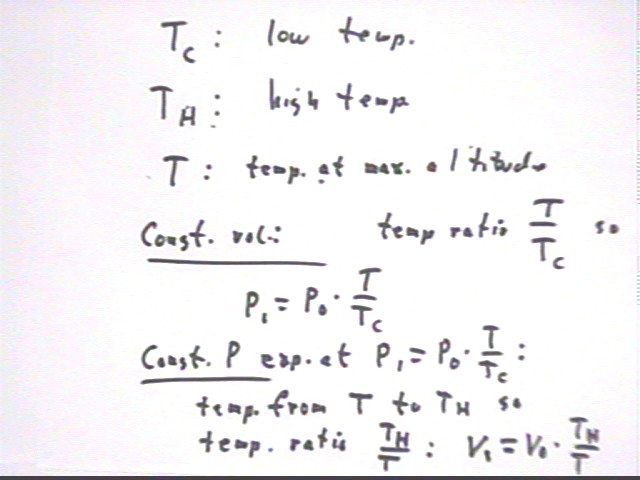
The figure below shows P vs V for a system with initial pressure and volume P0 and V0, max temperature Th and initial temperature Tc. We assume that water is allowed to rise to a height requiring gas temperature T, before being allowed to flow out of the tube. We observe that
m g y1 = density * volume of displaced water * g * y1 =
rho `dV * g y1 =
(V1 - V0) * rho g y1 =
`dV * `dP =
(V0 * Th / T - V0) * (P0 * T / Tc - P0) =
V0 * P0 ( Th / T - 1) ( T / Tc - 1) =
V0 P0 * ( 1 + Th / Tc - Th / T - T / Tc).
Recall that the translational KE of each molecule is 3/2 k T so that the internal KE translational of the system is 3/2 N k T, where N is the number of molecules, and that since N k = n R this is equal to 3/2 n R T. It follows that KE per degree of freedom is 1/2 n R T. Note also that in a diatomic gas there are 3 degrees of translational freedom and 2 of rotational freedom, so there are 5 degrees of freedom and the internal KE of the gas is therefore 5 * (1/2 n R T) = 5/2 P V.
We find that the total energy supplied during these two cycles of our engine is
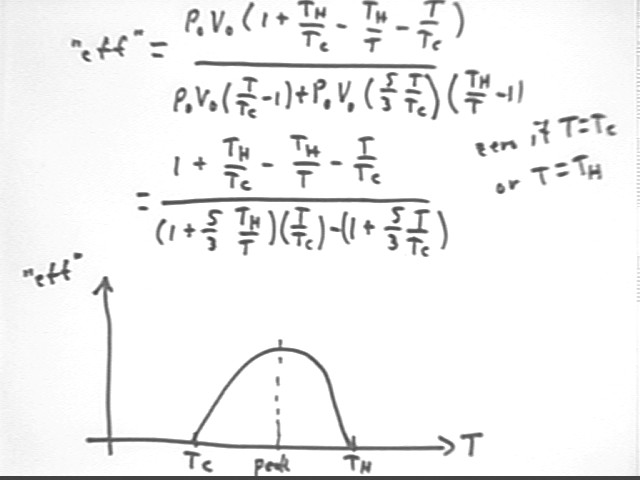
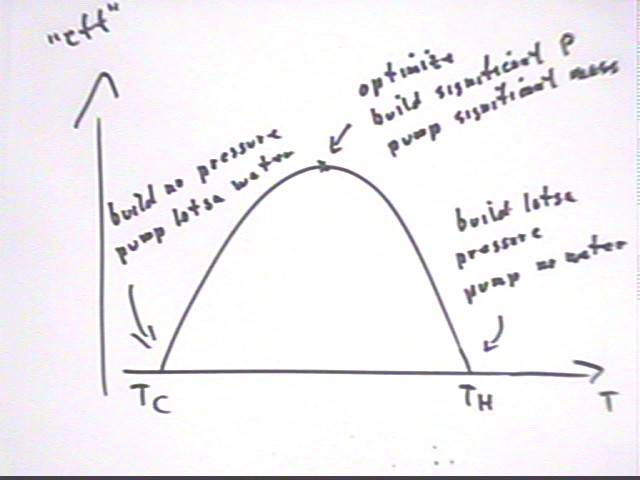
The practical 'efficiency' (practical 'efficiency' being useful work divided by thermal energy transferred, as opposed to thermodynamic efficiency which is based on all work done by the system, useful or otherwise; the quote marks around 'efficiency' indicate that this is the practical, not the thermodynamic, efficiency) of this process is therefore
which simplifies to
This expression can be further rearranged for different purposes, but here it will be left in the indicated form. The fractions 5/2 and 7/2, and the ratios Th / Tc, Th / T and T / Tc all have meanings which can be directly understood in terms of the model, with 5/2 and 7/2 related to degrees of freedom and work done in constant-volume and constant-pressure expansions, T / Tc the factor by which pressure increases, Th / T the factor by which volume increases and Th / Tc the ratio of final to initial temperature. (T / Tc - 1) is the pressure change as a proportional of initial pressure, and Th / T the volume change as a proportion of initial volume.
The figure below shows the calculation of the 'efficiency' and a graph of this 'efficiency' vs. temperature T.
The graph of 'efficiency' vs. T depicts the optimal temperature T for a given Tc and Th.
The figure below depicts an accurate graph of 'efficiency' (again, practical efficiency) vs. cutoff temperature T, for the 'engine' used in the experiment.
The graph below again indicates the curve represented above, but on a scale from 270 K to 370 K and with a vertical scale extending to 'efficiency' .025 rather than .007. This results in the smaller of the two curves below. You should verify that the smaller curve reaches a peak 'efficiency' of about .007 and runs between 273 K and 297 K.
The larger curve depicts the same 'engine' running between 273 K and 373 K.
We note that the larger curve reaches its peak efficiency about halfway between Tc and Th, as was the case for the first curve, and that this peak efficiency is .025, almost 4 times the .07 observed for the first.
The
When you have completed the entire assignment run the Query program.