The figure below shows two waveforms, the top one moving toward the left and the second toward the right. One waveform can be thought of as a traveling wave in a string or a chain or a slinky, the second as the form of the wave after being reflected at one end.
The bottom graph shows the result of adding the two waveforms together. Note that since the peaks and valleys of the original two waveforms are perfectly lined up the amplitude of the resultant waveform is double that of the two original waveforms.
The next figure is identical to the one above except that the waveform at top has moved a bit to the left, and the second waveform has moved a bit to the right.
Note that the amplitude of the resultant waveform is a bit less than in the preceding graph. This is because the peaks and valleys of the first two waveforms don't line up as well as in the first graph.
In the next figure the two waveforms have moved even further. Now the peaks of one graph are almost lined up with the valleys of the other, and the waveforms nearly 'cancel' one another.
Note however that the peaks of the resultant waveform occur at exactly the same place as the peaks of the resultant waveforms in the first two figures..
The waves continue moving; now the valleys of the first wave are slightly to the left of the peaks of the second (note how in the preceding figure they were to the right).
The resultant waveform appears about the same as before, but note that the resultant waveform in this figure has peaks where the resultant waveform in the preceding picture had valleys.
As the two original waveforms continue moving the peaks of both graphs begin to again align, as do the valleys, and the resultant waveform continues to grow.
The figure below shows a series of resultant waveforms obtained by a process similar to that used above.
The first form represents the resultant wave at some initial instant when the peaks of the two original waves align perfectly.
The second form represents the resultant wave a short time later, when the peaks don't quite align.
In the third form the original waves continue to shift and the peaks go further out of alignment.
In the fourth and fifth forms the peaks of one wave move toward alignment with the valleys of the other, so that in the fifth form the two original waves are seen to nearly cancel one another.
In the sixth form the orientation of the original wave is now reversed as a result of the continued shift in the two original waves.
You should correlate this series of resultant waveforms with the process described by the previous pictures.
What is the frequency of the third harmonic in a chain of length 5 meters and mass 2 kg, under a tension of 9 Newtons?
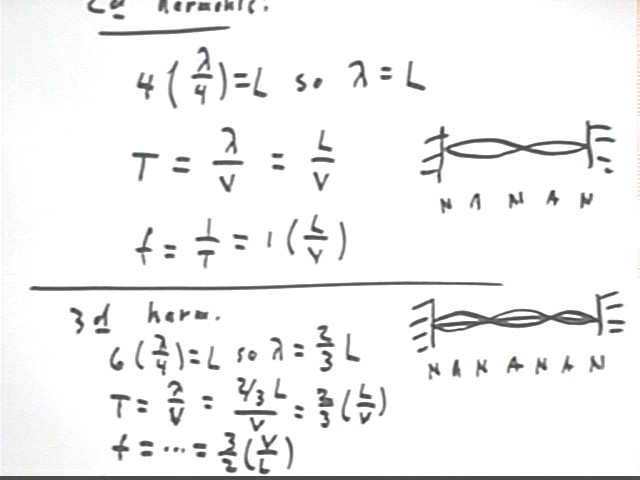
The figure below shows the calculation of the propagation velocity of the wave.
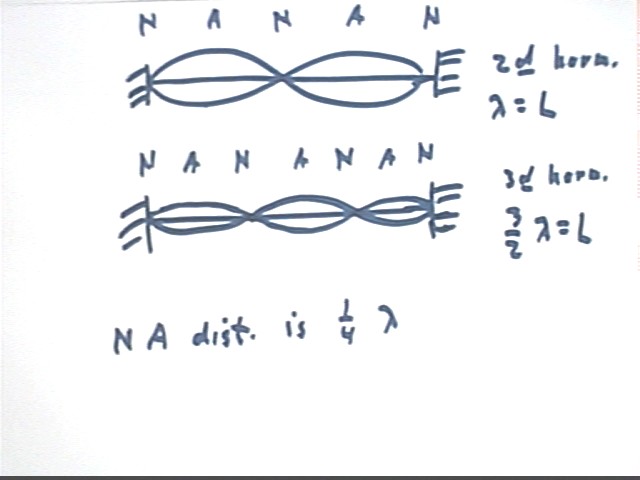
We also briefly review from before the node-antinode sequence of the first three harmonics.
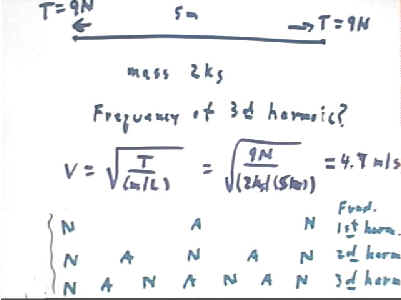
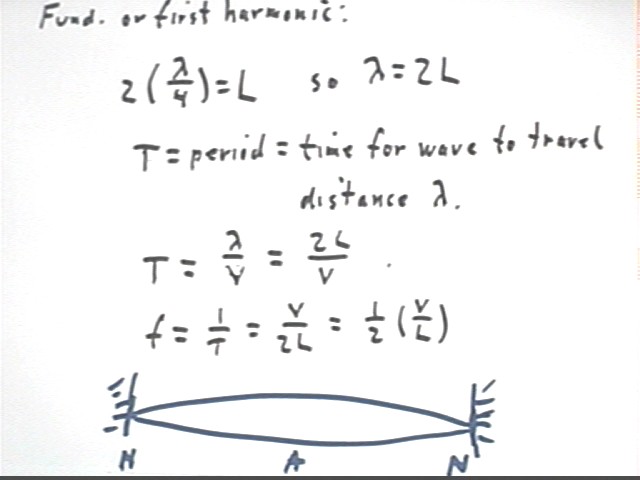
The first harmonic has two node-antinode distances spanning the length L of the string.
Since a node-antinode distance is 1/4 of a wavelength it follows that the wavelength is 2 L.
The period of the wave is the time required to travel a distance equal to the wavelength, which we see in this case is T = 2 L / v. NOTE: Don't confuse the T that stands for period with the T that stands for tension. The two are seldom used in the same context so it shouldn't be difficult to keep them straight.
The frequency (typically number of cycles per second) is the reciprocal of the period (typically number of seconds per cycle), so we see that the frequency of the fundamental will be 1/2 * v / L.
A similar analysis for the second and third harmonics gives us the wavelengths of these harmonics.
We also find the corresponding frequencies, using the same procedures as above.
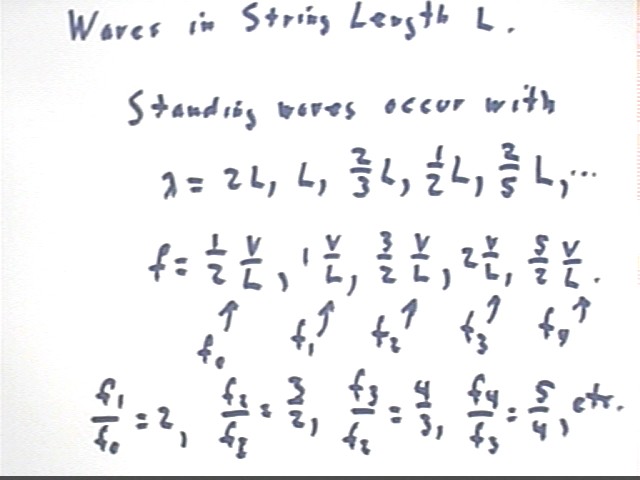
The pattern of the above analysis tells us that standing waves occur with the wavelengths and frequencies indicated below.
We call the frequency of the first harmonic f0, the second f1, the third f2, etc.
We find that these frequencies have successive ratios 2, 3/2, 4/3, 5/4, etc..
These frequency ratios are the basic of nearly all music. Most music is based on frequency ratios which are powers of the twelfth root of 2; the 12th, 7th, 5th and 4th powers of this number closely approximate the ratios 2, 3/2, 4/3, 5/4. The next power of 2 that approximates these ratios better is the 43d root of 2. This is the reason that the 12-tone scale pervades most world music, though some Eastern music does use the 43d root of 2. You'll see more about this in the problem sets and in your text.
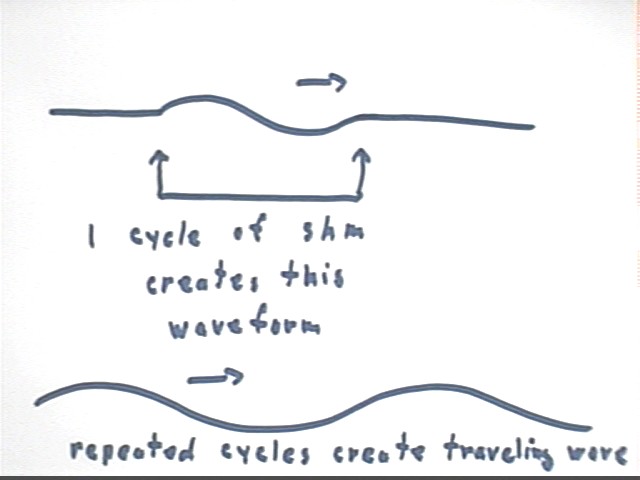
A complete cycle of simple harmonic motion induced at the end of a string, a Slinky or a chain, under constant tension, results in the sinusoidal waveform depicted below.
Repeating cycles create the sinusoidal traveling wave at the bottom of the figure below.
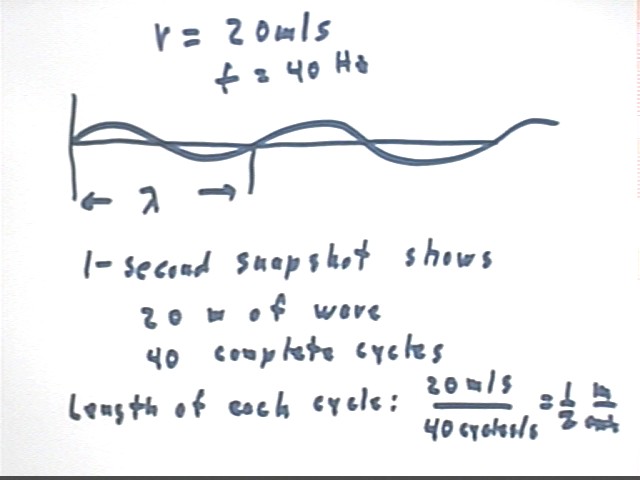
If a traveling sinusoidal wave with frequency 40 Hz (a Hz is a cycle per second) propagates at 20 m/s then what is the wavelength of the wave?
The wavelength is the distance from the beginning to the end of a complete cycle. This distance is also equal to the peak-to-peak distance.
Imagine a string originating in another room, entering this room through a hole in the wall. The end of the string in the other room is driven in simple harmonic motion. A detector at the wall triggers a timer when the waveform first enters the room, and 1 second later a stop-action picture of the part of the string in this room is taken. Assuming that our room is at least 20 meters long this picture will depict 20 meters of the waveform, which will contain 40 complete cycles.
Cycles will therefore span 20 meter / (40 cycles) = 1/2 meter per cycle.
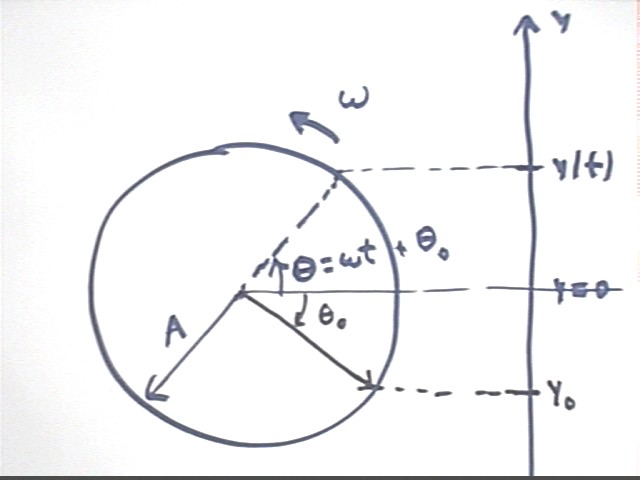
Recall that simple harmonic motion can be modeled by the projection of a point moving on a reference circle of appropriate radius at the appropriate angular velocity, starting from some initial position.
If the circle has radius A and if the initial (t = 0) angular position of the point is theta0, the the angular position at clock time t is theta = omega * t + theta0.
If we model the y projection of this point we will have y(t) = A sin(omega * t + theta0).
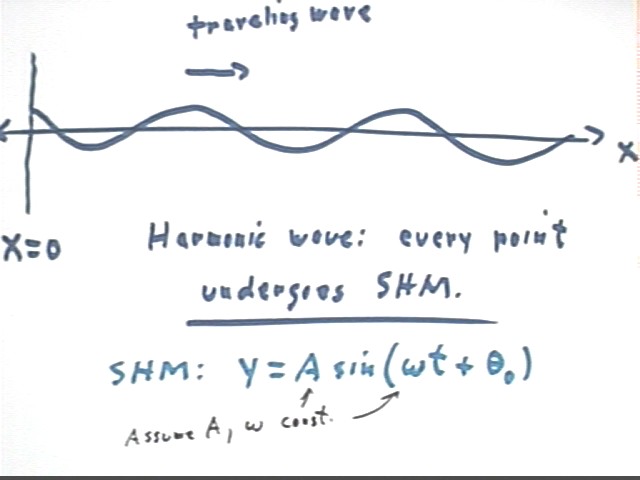
On a transverse sine wave traveling in the x direction, every point on the wave moves up and down somewhat like a cork bobbing in the waves on a lake.
As seen previously the general form of the equation of SHM is y(t) = A sin(omega * t + theta0).
It is clear that at any given instant different points on the traveling wave will be at different positions, even though for every point omega and t will be the same. It follows that theta0 will be different for different points on the wave.
The figure below depicts the motion of one point on a traveling wave.
The wave is traveling to the left. The vertical line indicates a fixed position on the wave.
The first graph shows the wave at a certain instant, with the indicated point lying close to the 'peak'.
In the second graph the wave has moved on a bit to the left, and the indicated point is now a bit lower, approaching the equilibrium position.
In the third graph the wave is still further to the left and the point is now below the equilibrium position.
In the final graph the wave is still further to the left and the point is near the lowest possible position.
It should be clear that as the wave continues to move to the left the point will rise again thru equilibrium then to its peak position, before repeating its cycle.
 Assignment 9
When you have completed the entire assignment run the Query program.