Analysis of depth vs y for coke bottle (quiz form with solution)
Give the following results from your analysis of the experiment done with the coke bottle:
Your analysis should result in a depth vs. clock time graph that decreases at a decreasing rate (i.e., decreasing and concave upward).
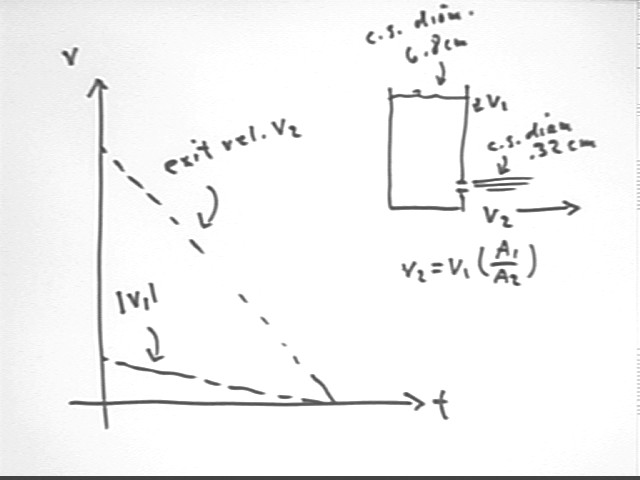
The speed v1 of the water surface is related to the speed of the exiting water by the ratio of the cross-sectional areas of the container and the tube through which water exits.
Our data will give us direct information about v1 and v2:
Since v2 = v1 * ( A1 / A2) we expect that the slope of the v2 vs. t graph will be A1 / A2 times that of the | v1 | vs. t graph.
For the given container the cross-sectional diameters of container and tube are 6.8 cm and .32 cm, so that the ratio A1 / A2 of areas will be (6.8 / .32)^2 = 450, approx..
v2 vs. t and v1 vs. t results from one group indicate a v2 / v1 ratio around 500, with a margin of error of +-150. This is consistent with the measured area ratio of 450.