Physics II Basic Flow Experiment
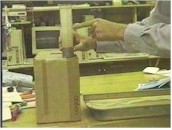
The picture below shows a uniform cylinder filled
with water, and set upon a box about a foot high (you will use a soft
drink bottle).
- A ruler is taped to the tube (you can use
a ruler, a tape measure, or marks made at carefully measured intervals on the tube).
- The idea is to be able to measure the depth of
the water above the hole at regular time intervals as it flows out
of the hole near the bottom of the tube.
- The instructor is holding his thumb over the hole.
Based on your knowledge of physics, answer the following,
and do your best to justify your answers with the physical reasoning and insight:
- Would you expect the rate of flow to increase,
decrease or remain the same as water flows from the
cylinder?
- As water flows out of the cylinder, an imaginary buoy
floating on the water surface in the cylinder would descend.
- Would you expect the velocity of the water
surface and hence of the buoy to increase, decrease or remain
the same?
- How would the velocity of the water
surface, the velocity of the exiting water, the
diameter of the cylinder and the diameter of
the hole be interrelated? More specifically how could you determine
the velocity of the water surface from the values of the other quantities?
- The water exiting the hole has been accelerated,
since its exit velocity is clearly different than the velocity it had in the cylinder.
- Explain how we know that a change in velocity implies
the action of a force?
- What is the nature of the force that
accelerated it?
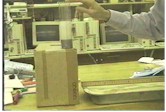
In the next sequence of pictures the water is flowing out
of the hole.
The water stream is just barely
visible.
- The pictures are taken at fairly but not
precisely regular time intervals.


From the pictures, answer the following and justify your
answers, or explain in detail how you might answer the questions if the pictures were
clearer:
- Does the depth seem to be changing
at a regular rate, at a faster and faster rate,
or at a slower and slower rate?
- What do you think a graph of depth
vs. time would look like?
- Does the horizontal distance (the distance
to the right, ignoring the up and down distance) traveled by the stream increase or
decrease as time goes on?
- Does this distance change at an increasing,
decreasing or steady rate?
- What do you think a graph of this horizontal
distance vs. time would look like?
You can easily perform this experiment in
a few minutes using a 2- or 3- liter soft drink bottle.
- Poke a hole about 1/4" in diameter
about an in the side of the bottle about an inch above the bottom.
- You want the size of the hole to be such that a full
bottle will empty through the hole in a minute or two.
A smaller hole and a longer time give better
results, but don't go to extremes. Ideally it should take about a minute or
two for the water to exit the bottle.
- Fill the bottle about 3/4 of the way full.
- The bottle, between the filling point and the hole, isn't
a perfectly uniform cylinder, but it's reasonably close.
- Use a ruler or tape measure to
measure distance.
- Use a watch to measure the time.
- We will use 'clock time' to refer to the time
since the very first reading. The very first reading will
therefore be at clock time 0.
You can take data in one of two ways.
- You can write down the clock time every
time the water crosses another centimeter line on the ruler.
- Or you can write down the reading on the ruler at
regular time intervals, e.g., every 10 seconds.
- You will want about 10 readings, spread
out over the time required for the bottle to empty.
You will obtain data which can be put into the following
format:
| clock time (in seconds, measured from first
reading) |
Depth of water (in centimeters, measured from
the hole) |
0 |
14 |
10 |
10 |
20 |
7 |
etc. |
etc. |
Your numbers will of course differ from
those on the table.
Get a ruler, a watch, set the experiment up, and take a careful
set of measurements.
The following questions were posed
above. Do your data support or contradict the answers
you gave above?
- Is the depth changing at a regular
rate, at a faster and faster rate, or at a slower and
slower rate?
- What does the graph of depth vs.
clock time look like?
Analyze the motion of the water surface:
- For each time interval, find the average velocity of
the water surface.
- Assume that this average velocity occurs at the midpoint of
the corresponding time interval.
- Make a table of average velocity vs. clock time, and
for each time interval of this table determine the average
acceleration of the water surface.
- Do you think the acceleration of the water surface is constant,
increasing or decreasing?