"
Physics II
Class Notes, 2/03/99
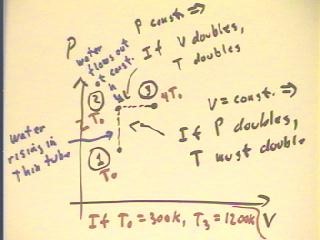
Consider the figure below, which shows a graph of part of
a cycle of a hypothetical bottle engine starting at some
pressure and volume, at temperature T0.
- The cycle from State 1 to State 2 sees an increase
in pressure in order to get water to the desired height.
- From the graph we estimate that the pressure has
doubled and that therefore the temperature has doubled
(remember that volume is constant) from T1 = T0 to T2 = 2 T0.
- The cycle from State 2 to State 3 takes place at constant
pressure, as the water height remains constant while
water flows out of the high end of the tube.
- From the graph we estimate that the volume of
the system has doubled and that therefore the temperature has
again doubled (since pressure remains constant), this time from T2
= 2 T0 to T3 = 4 T0.
- It follows that if we begin at temperature T0 = 300 K,
the cycle as pictured will have a maximum temperature of around T3
= 1200 K (this is why the bottle engine is hypothetical; water vaporizes at this
temperature, and plastic melts--however, we could use other materials and other liquids to
make a similar engine that operates at these temperatures).
We contrast this with the system as it would operate between
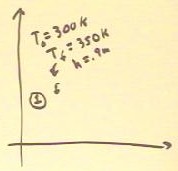
temperatures T0 = 300 K and T3 = Tf = 350 K (these are
the approximate temperatures used in the experiment).
- If the altitude to which water is raised is h = .9 meters,
which is the approximate altitude where the maximum work is
done for these temperatures (see previous class notes), then the pressure will
increase from approximately 100 kPa to 109 kPa.
- This pressure increase is shown roughly to scale on
the graph.
- From calculations done previously we see that the temperature of State
2 and compared with 350 K is such that ratio
of temperatures is implies a volume expansion of
about 6% of the original volume.
- This volume increase is
shown roughly to scale on the graph.
If we complete the cycle, for example by releasing
the pressure or by simply removing the bottle
from the thermal source, we will return to the original
pressure and temperature.
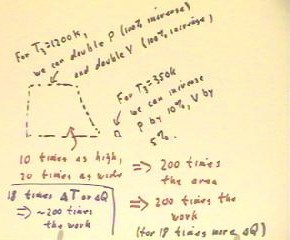
The graphs below show the two cycles, for the two
different high temperatures T3 = 1200 K and T3 = 350 K,
with the assumption that pressure is released suddenly (e.g.,
by opening a valve) and then the system is permitted to cool in the room
until it reaches its original state.
The total work done for each cycle is the area
enclosed by the graph of the cycle. We note that the work
done for the 1200 K temperature is much greater than
for the 350 K temperature.
We can actually compare the approximate areas enclosed
by these graphs.
- For the first graph the pressure doubles, which is a 100
% increase, while for the second the pressure increases by
approximately 10%. So the first graph is about 10
times higher than the second.
- For the first graph the volume doubles, which is a 100%
increase, compared to the approximate 5% increase in the volume
of the second system. Thus the width of the
graph of the first cycle is approximately 20 times that
of the second.
- This implies that the first graph encloses approximately 10 * 20 = 200
times the area of the first.
We can also compare the amount of thermal energy required
to 'run' the system through one cycle.
- The temperature of the first increases by 900 K in the
first cycle and by 50 K in the second,
so that the first cycle will require roughly 20 times as
much thermal energy as the first.
We thus see that we must put about 20 times the thermal energy
into the first cycle; however we get about 200 times the work
out of the cycle. That seems like a pretty good deal.
- In fact this shows that the first cycle is about 10 times as
efficient as the second.
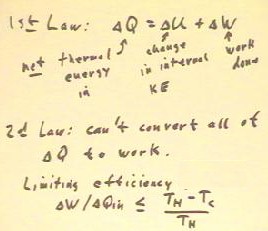
The Second Law of Thermodynamics is illustrated by the bottle
engine processes we have just analyzed, where we have seen that the work
performed by the system is and must always be less than,
never equal to, the thermal energy put into the
system.
The Second Law can be stated in a number of ways, as
in your text.
One of the most common statements is that it is impossible for
a repeating thermal cycle to convert all available thermal energy
to work.
- A more specific statement is that the limiting efficiency `dW / `dQin for
a thermal engine of any kind, operating between temperatures
Tc and Th, is (Th - Tc) / Th.
- Note that for a thermal engine operating between 300 K and 350 K, this limiting
efficiency is 50 K / 300 K = .16... , while between 300
K and 1200 K the limiting efficiency is 900
K / 1200 K = .75, nearly 5 times as great.
- Note that for the bottle engine it is not possible,
even theoretically, to get even close to these limits.
- The bottle engine as illustrated above involves two isobaric (constant-pressure)
processes (where the gas expands to its maximum volume and where did contracts back to its
original volume), an adiabatic expansion (where pressure is released) and
an isochoric process (where pressure changes at constant volume).
- We say that the cycle is bounded by these processes.
- The only engine that can theoretically achieve these limits
is the Carnot engine, where the cycle is bounded by
two isothermal and two adiabatic processes.
In a complete cycle, the system keeps coming back to
the same state.
- Thermal energy goes into the system during
some processes (e.g., for the bottle engine, during the pressure buildup and during the
expansion of the gas in order to 'pump' the water), and comes out of the
system during some processes (e.g., when we allow the bottle to cool back to room
temperature).
We can therefore say that thermal energy `dQh goes into the
system from the 'hot reservoir' (e.g., the hot water), work
W is done by the system, and thermal energy `dQc is
taken out of the system and enters the 'cold reservoir' (e.g.,
the room).
- From energy conservation (the First Law), it should be clear that `dQh
= `dW + `dQc, and that `dW = `dQh - `dQc.
- Since the efficiency of the system is `dW / `dQh it
follows that efficiency can be expressed as efficiency
= (`dQh - `dQc) / `dQc, or that `dQc can be expressed as `dQc = `dQh / (1
+ efficiency).
By observing a pulse moving down a 20 m string and
back, we see that the more tension we put into the string the faster
the pulse travels.
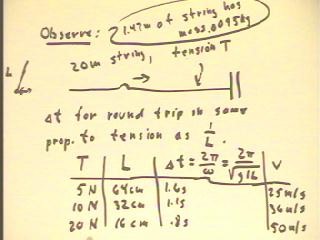
By synchronizing the round trip of a pulse in
a string of length 20 m, under different tensions from 5
N to 20 N, with the period of a pendulum, we
obtain the data indicated below for pendulum length L vs.
string tension T.
- We observe that a doubling of tension is associated
with a halving of pendulum length; recalling that pendulum
period is inversely proportional to the square root of
pendulum length, we reason that the time required for
the pulse to travel the 40 meters is inversely proportional to
the square root of the tension.
- From this it follows that the velocity of the pulse must be proportional
to the square root of the tension.
- This result is predicted theoretically by the Impulse-Momentum
Theorem.
- We determine the time `dt required for the pendulum to
complete its cycle in each case, recalling that the angular
frequency of the pendulum in radians/second is `sqrt(g /
L).
Using these results we infer the pulse velocities
in the table below.
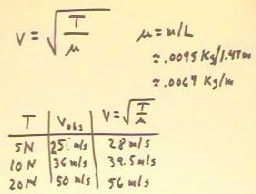
The velocity of a pulse in a string is
theoretically given by v = `sqrt( T / `mu), where 'mu
is the mass per unit length of the string.
- Note that in the figure below L stands for the length of the string and
not the length of the pendulum used in the experiment,
which is merely a timing device and whose properties have nothing else to
do with the properties of the string.
- The quantity `mu is easily calculated from the mass
and the length of a sample of the string.
- The velocities predicted by this formula for the given string are as indicated
in the figure below.
Measuring the time required for a fundamental cycle of
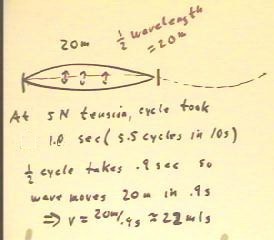
the fixed 20 m string, we determine that for the 5 N tension a
complete cycle requires 1.8 seconds.
- This complete cycle corresponds to the time required for
a full cycle of a sine wave to travel 40 meters,
double the length of the string.
- The fundamental mode of vibration of the string,
depicted in the figure below, occurs when the reflected half-cycle of the
wave meets the opposite half-cycle as it travels in the
opposite direction down the string.
- Since the cycle requires 1.8 sec, the 1/2
cycle that corresponds to the time required for the wave to
travel the 20 m length of the string is .9 s, implying a
wave velocity of 22 m/s.
- We therefore have a predicted wave velocity of 28 m/s,
an observed pulse velocity of 25 m/s, and and observed wave
velocity of 22 m/s.
- These quantities should theoretically be equal, since
each corresponds to the velocity of a disturbance traveling
in the string.
"
