Basic Flow Experiment
One of the most important things we use mathematics for is
to model real-world situations. This experiment,
which can be run simply and quickly using a 2- or
3-liter soft drink bottle and a rule or tape measure, illustrates the modeling
process used throughout the course.
- This process is essentially the same as that used by scientists,
economists, social scientists, business analysts, and anyone who models situations
involving functions and changing rates.
- The behavior of functions with changing
rates is the subject of calculus; this course is designed to
prepare you for calculus by studying various functions and their behavior.
This experiment involves a physical situation,
but we are not doing physics here.
- Physics involves the reasons the system behaves
as it does, due to things like energy conservation, fluid
properties, etc.
- The mathematics of the situation involves linear
and quadratic functions, the quadratic equation
and systems of simultaneous equations.
- We aren't going to talk about physics, we aren't
going to do physics, we are going to do the mathematics.
- The physical situation is used because it is simple,
it gives us precise results, it can be done quickly, and
it is very tangible and concrete.
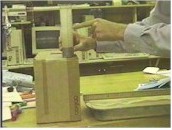
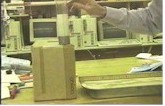
The picture below shows a uniform cylinder filled
with water, and set upon a box about a foot high (you will use a soft
drink bottle).
- A ruler is taped to the tube (you can use
a ruler, a tape measure, or marks made at carefully measured intervals on the tube).
- The idea is to be able to measure the depth of
the water above the hole at regular time intervals as it flows out
of the hole near the bottom of the tube.
- The instructor is holding his thumb over the hole.
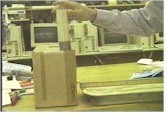
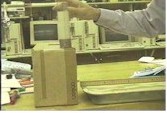
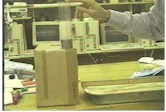
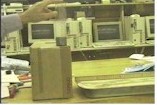
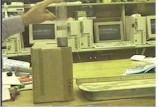
In the next sequence of pictures the water is flowing out
of the hole.
The water stream is just barely
visible.
- The pictures are taken at fairly but not
precisely regular time intervals.

From the pictures, answer the following:
- Does the depth seem to be changing
at a regular rate, at a faster and faster rate,
or at a slower and slower rate?
- What do you think a graph of depth
vs. time would look like?
- Does the horizontal distance (the distance
to the right, ignoring the up and down distance) traveled by the stream increase or
decrease as time goes on?
- Does this distance change at an increasing,
decreasing or steady rate?
- What do you think a graph of this horizontal
distance vs. time would look like?
It is recommended that you perform
this experiment, as described below.
- You will learn a lot more about
how mathematics models real-world situations if you take
a few minutes to experience the situation; the exercise will be well
worth your time.
- If you prefer, you may go the the site
flow experiment simulated data and obtain a set
of simulated data.
You can easily perform this experiment in
a few minutes using a 2- or 3- liter soft drink bottle.
- Poke a hole about 1/4" in diameter
about an in the side of the bottle about an inch above the bottom.
- You want the size of the hole to be such that a full
bottle will empty through the hole in a minute or two.
A smaller hole and a longer time give better
results, but don't go to extremes.
- Fill the bottle about 3/4 of the way full.
- The bottle, between the filling point and the hole, isn't
a perfectly uniform cylinder, but it's reasonably close.
- Use a ruler or tape measure to
measure distance.
- Use a watch to measure the time.
- We will use 'clock time' to refer to the time
since the very first reading. The very first reading will
therefore be at clock time 0.
You can take data in one of two ways.
- You can write down the clock time every
time the water crosses another centimeter line on the ruler.
- Or you can write down the reading on the ruler at
regular time intervals, e.g., every 10 seconds.
- You will want about 10 readings, spread
out over the time required for the bottle to empty.
You will obtain data which can be put into the following
format:
| clock time (in seconds, measured from first
reading) |
Depth of water (in centimeters, measured from
the hole) |
0 |
14 |
10 |
10 |
20 |
7 |
etc. |
etc. |
Your numbers will of course differ from
those on the table.
Get a ruler, a watch, set the experiment up, and take a careful
set of measurements.
The following questions were posed
above. Do your data support or contradict the answers
you gave above?
- Is the depth changing at a regular
rate, at a faster and faster rate, or at a slower and
slower rate?
- What does the graph of depth vs.
clock time look like?
(Precalculus I students be sure to read the
subsequent note below). Follow the directions given in
Analyzing the Data and Understanding the
Modeling Process and
Completing the
Initial Flow Model.
Precalculus I students note: These worksheets are part of a
subsequent assignment on your Assignments page, and you may wait to complete the
worksheets until you get to that assignment. You may of course do them
now, which will give you a head start on your next assignment.