Precalculus I Class 02/11
NOTE ARE MOSTLY COMPLETE; WILL BE COMPLETED SOON
More Notes on Transformations
Preparation for Power Functions:
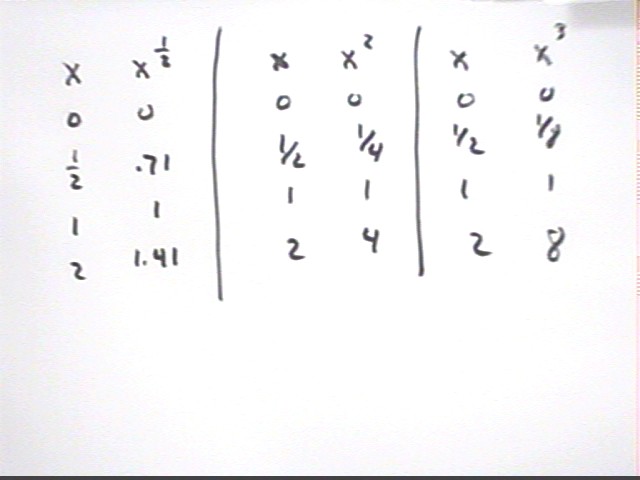
Using x values 0, 1/2, 1 and 2 make tables and sketch graphs of each of
each of the following functions:
- y = x^2
- y = x^3
- y = x^(1/2)
- y = x^(1/3)
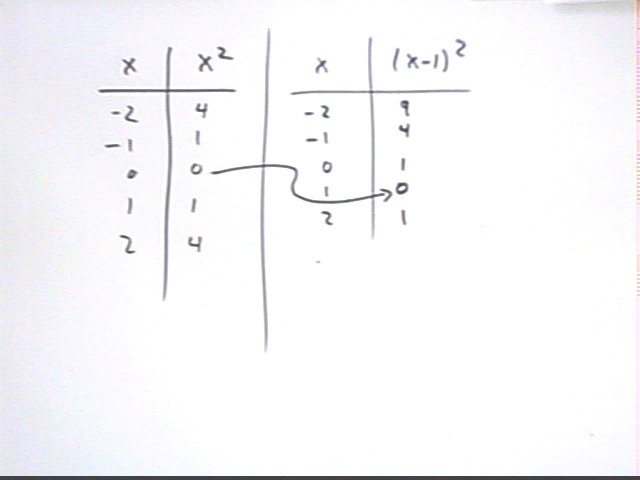
Tables for three of these functions are shown below:
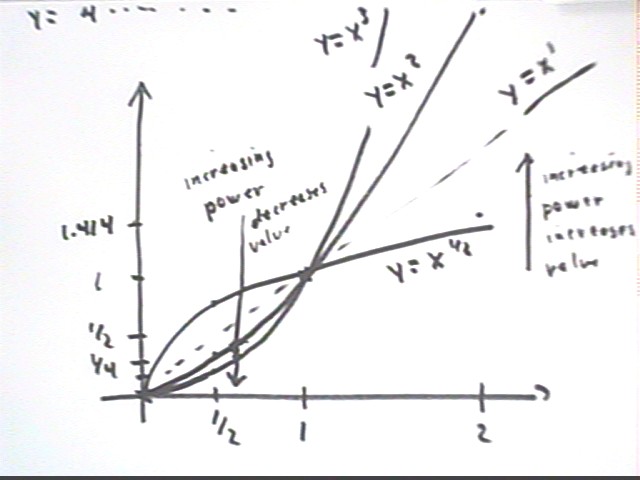
The corresponding graphs are constructed below. Note the
following:
- All these graphs pass through (0, 0) and (1, 1).
- With increasing powers of x the x = 1/2 values decrease,
while the x = 2 values increase.
The y = x^1 function is also indicated as a dotted line.
You should be able to infer from these patterns what the y =
x^(1/3) graph will look like. You can then check with the your table and
if you wish with the output of a graphing calculator.
Using x values 1/4, 1/2, 1, 2 and 4 make tables and sketch graphs of
each of each of the following functions:
- y = x^-1
- y = x^-2
- y = x^-3
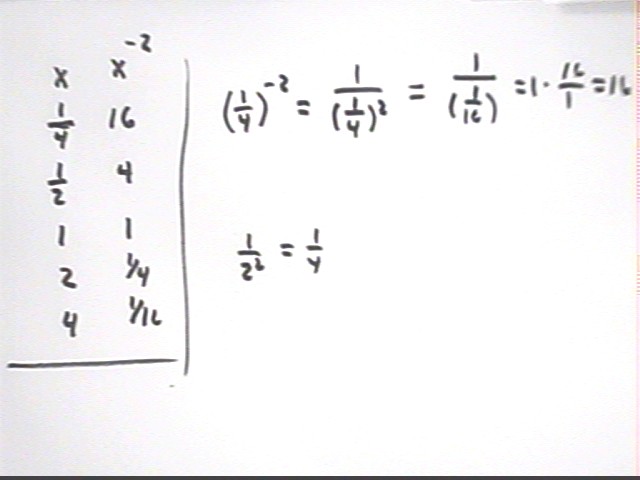
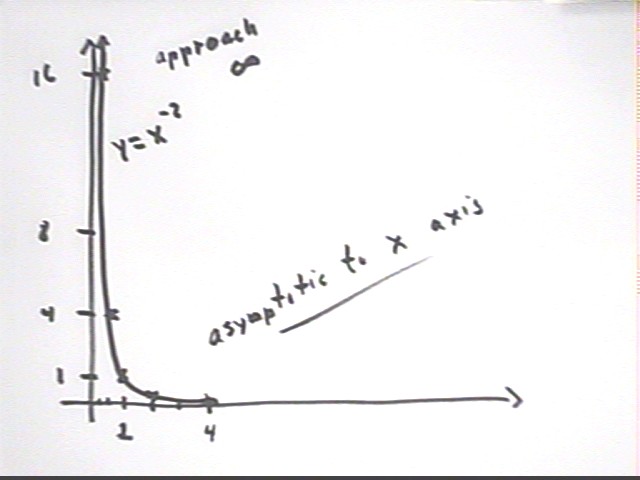
The table for y = x^-2 is constructed below. Note the
following:
- x^-2 = 1 / x^2.
- The calculation for x = 1/4 is shown below, as is the
calculation for x = 2.
The pattern should be clear.
- The graph passes through (1, 1), as is the case with all
basic power functions.
- Since 1 / 0 is not defined, x^-2 is not defined at x =
0.
- The closer x gets to 0 the larger its value, and since
there is no limit to how close x can get to 0 there is no limit to how large
x^-2 can get. This causes the graph to have a vertical asymptote at x
= 0.
- As x gets large, x^-2 approaches, but never reaches
0. This causes the graph to approach the x axis as an asymptote.
The graph below depicts these characteristics.
Using the graphs you have already sketched sketch the graphs of the
following:
- y = x^3 / 2
- y = 3 x^(1/2)
- y = (x-2)^3 + 1
- y = (x+1)^-2 - 2
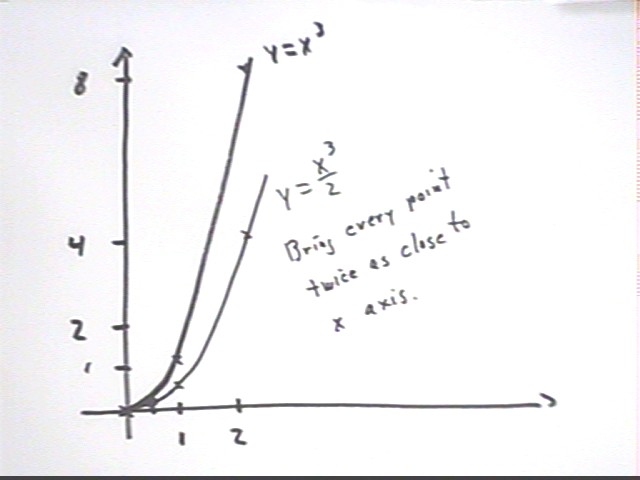
The graph of y = x^3 / 2 is a vertical stretch by factor 1/2
of the graph of y = x^3. The graph should be constructed from the graph of
y = x^3 by bringing every point twice as close to the x axis, not by plugging in
values and making a table.
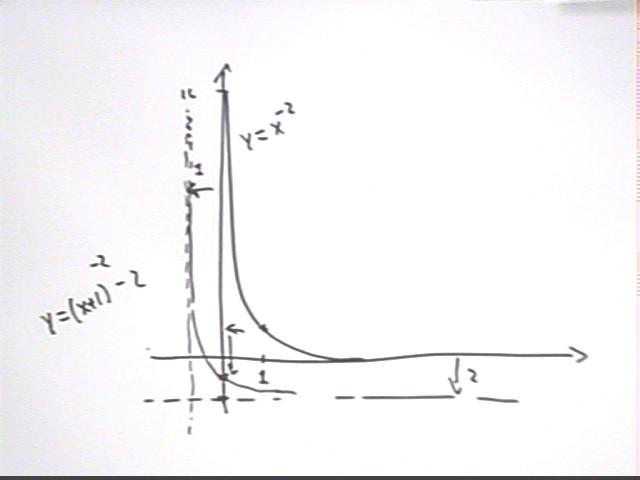
To construct the graph of y = (x+1)^-2 - 2 we note that this
is the function we get if we start with y = x^-2 and replace x by x + 1, then
add -2 to our result.
- Replacing x by x + 1 shifts the graph 1 unit to the
left. We accomplish this by shifting the y axis 1 unit to the
left. Since the y axis is a vertical asymptote for the original
function the line x = -1, which lies 1 unit to the left of the y axis, will
be the vertical asymptote for the new function.
- Adding -2 to the result lowers all y values by 2. We
accomplish this by shifting the x axis 2 units lower, obtaining the line y =
-2. Since the x axis is a horizontal asymptote for the original
function the line x = -2 will be a horizontal asymptote for the shifted
function.
- We also shift the point (1, 1) down 2 units and 1 unit to
the left, obtaining the point (0, -1).
We construct our graph, giving it the same shape as that of
the y = x^-2 graph but now passing through (0, -1) and asymptotic to the lines x
= -1 and y = -2.
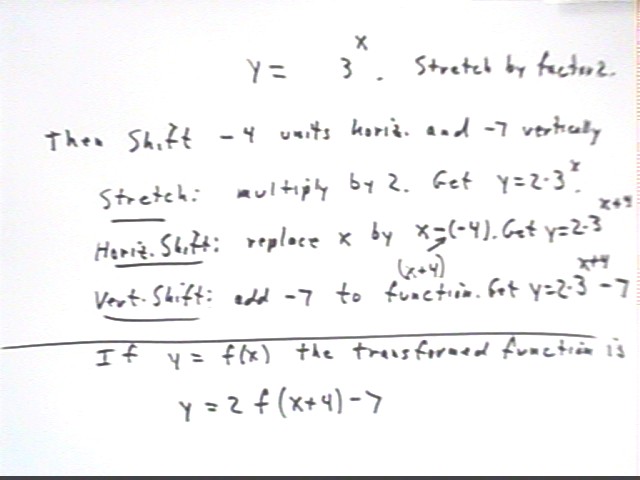
As another example of stretching and shifting we apply these
ideas to the function y = 3^x, which we stretch by factor 2 then shift -4 units
in the horizontal direction and -7 units in the vertical direction.
- To accomplish the stretch we multiply by factor 2. If
we were graphing we would move every point of the y = 3^x graph twice as far
from the x axis. The function at this point would be y = 2 * 3^x.
- The horizontal shift is accomplished by replacing x by x -
(-4) = x + 4. If we were graphing we would shift every point -4 units
in the horizontal direction, shifting the graph 4 units to the left. The
function at this point would be y = 2 * 3^(x+4).
- The vertical shift is accomplished by adding -7 to our
result. If we were graphing we would shift every point -4 units in the
vertical direction, shifting the graph y units in the downward direction.
The function at this point would be y = 2 * 3^(x+4) - 7.
In general if y = f(x) is any function we would follow the
same steps:
- Multiplying our function by 2 gives us y = 2 f(x), and
replaces each point on the graph of f(x) by a point twice as far from the x
axis.
- Replacing x by x + 4 we obtain y = 2 f(x+4), replacing each
point on the graph of y = 2 f(x) by a point 4 units to its left.
- Adding -7 to our result gives us y = 2 f(x+4) - 7,
replacing each point on the graph of y = 2 f(x+4) by a point 7 units lower.
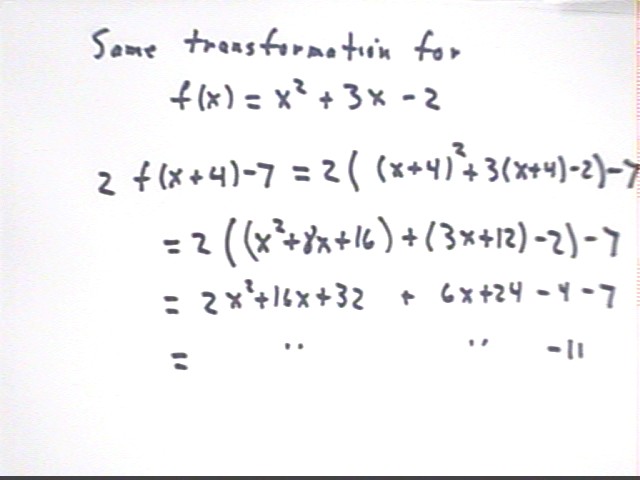
Thus for example y = f(x) = x^2 + 3x - 2 would be transformed
to y = 2 f(x+4) - 7, which can then be simplified.
Note that the final simplified form is not shown below.
This final form would be
Building a 2-unit cube from 1-unit cubes we find that we
require 2 layers, each with 2 rows each consisting of 2 cubes.
- We have a total of 4 cubes in each layer, for a total of 8
cubes.
- We note that 2*282 = 2^3 = 8.
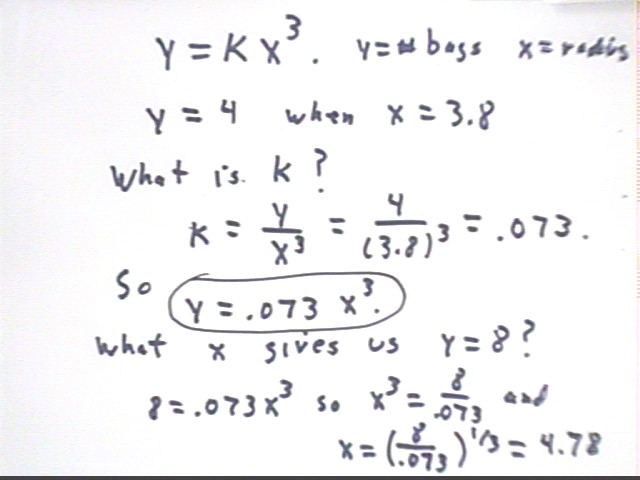
Dumping packets of salt at the center of a set of concentric
circles results in cones whose radii are related to the number of bags as
follows:
| radius of cone base |
number of bags |
| 2.3 |
1 |
| 3 |
2 |
| 3.8 |
3 |
| 4 |
5 |
| 4.7 |
8 |
The equation y = f(x) = m x + b describes the general form of a linear
function.
The statement y = f(x) = m x + b for b = 2 describes all possible linear
functions with b = 2. How could we depict this family on a graph?
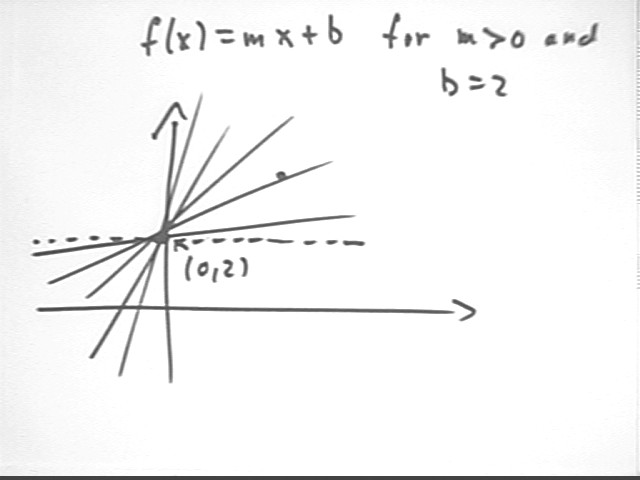
The statement y = f(x) = m x + b for m > 0 and b = 2 describes a
family of linear functions. How could we depict this family on a graph?
The statement y = f(x) = m x + b for m = .5 describes all possible
linear functions with b = 2. How could we depict this family on a graph?
Suppose that observations of the weight y supported by a hanging spring
vs. the length x of the spring include the following:
| length x (cm) |
weight y (Newtons) |
| 39 |
4 |
| 55 |
7 |
| 73 |
9 |
| 90 |
13 |
Sketch a graph of this data and sketch the straight line that you think
best fits the data. There is no reason the line should pass through any of the data
points--you're trying to get it as close as possible, on the average, to the data points.
Locate two points, neither of them data points, that actually lie on the
line you sketched and estimate as accurately as you can their coordinates. Using
these points find the equation of the line.
According to your equation
- What weight would correspond to a length of 80 cm?
- What length would result from a weight of 5 Newtons?
- What is the weight y corresponding to each of the give lengths?
- What is the deviation of each weight from the weight you just calculated?
- What is the average of the squares of these deviations?
If for every integer n we have a(n+1) = a(n) + n + 1, where a(n) is
function notation just like f(x), and if we know that a(0) = 2, then
- What equation do we get when we substitute 1 for n? What therefore
is a(1)?
- What equation do we get when we substitute 2 for n? What therefore
is a(2)?
- What equation do we get when we substitute 3 for n? What therefore
is a(3)?
Questions from assts, plus:
The figure below depicts a number of vertically stretched
quadratic functions.
- Identify the graph that represents the function y = x^2.
- Give the x = 3 coordinates of all the graphs whose x = 3
points are shown on the figure, as best you can estimate them.
- For each of these graphs estimate the x =2 coordinate.
- For each of the estimates you have made for the x = 3
coordinate, what fraction is that estimate of the x = 3 value of y =
x^2? That is, what do you get for (x = 3 value) / (3^2)?
- For each of the estimates you have made for the x = 2
coordinate, what fraction is that estimate of the x = 2 value of y =
x^2? That is, what do you get for (x = 2 value) / (2^2)?
- Identify the function whose x = 3 coordinate is
1.8. Since y = x^2 has value 9 when x = 3, the value y = 1.8 is 1.8 /
9 = 1/5 that of the x = 3 value of the y = x^2 function. Is the
value of the first function always 1/5 as great as that of the y = x^2
function?