Most Basic Properties of Linear, Quadratic,
Exponential Functions
You will need to thoroughly understand the graphs of the y = x, y = x^2
and y = 2^x functions. Much of the Precalculus course is based on these
functions.
You should be able to instantly sketch the graph of any of these
functions. Practice until you can do so without reference to these
pictures.
Basic Points (defining
points) of the Basic Linear Function y = x
Basic Points (defining
points) of the Basic Quadratic Function y = x^2
Basic
Quantities (defining quantities, two points and asymptote) of the Basic Exponential
Function y = 2^x
Basic Points of the
Basic Linear Function y = x
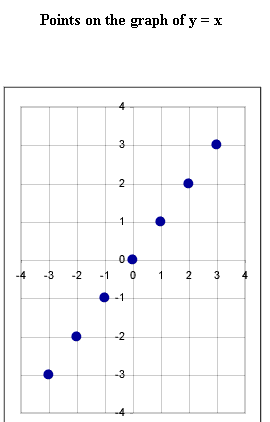
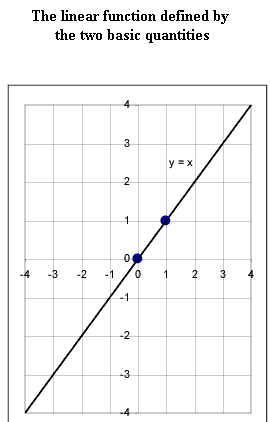
- The graph of y = x passes through the points indicated in the first graph,
as you can easily verify by making table.
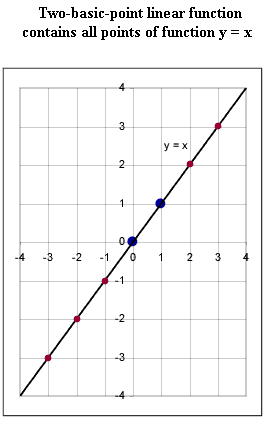
- The two basic points, which are the x = 0 and x = 1 points, are shown in
the second figure.
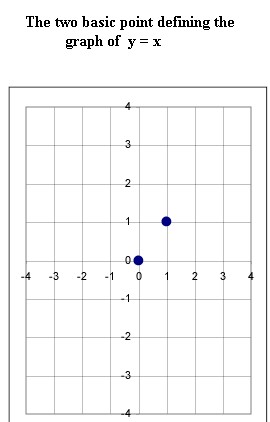
- The graph of y = x is defined by these two basic points as the straight
line passing through the points.
- Note in the second figure that this line contains all the points shown in
the original graph.
Basic Points of
the Basic Quadratic Function y = x^2
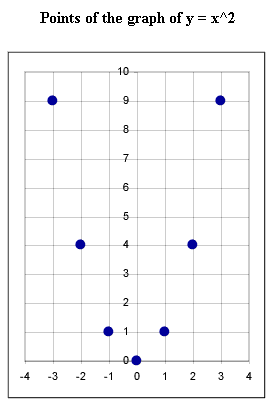
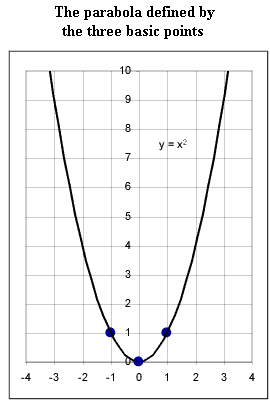
- The graph of y = x^2 passes through the points indicated in the first
graph, as you can easily verify by making table.
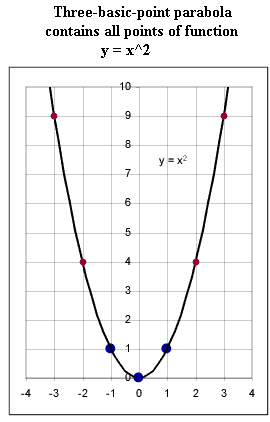
- The three basic points, which are the x = 0, x = 1 and x = -1 points, are
shown in the second figure.
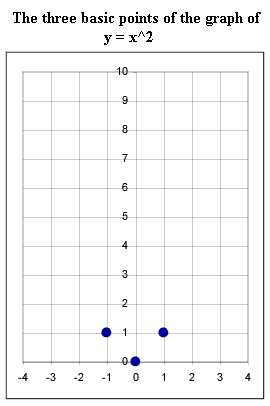
- The graph of y = x^2 is defined by these three basic points as the
parabola passing through the points. A parabola is a very specific
type of shape, not just anything which appears sort of U-shaped. Every
parabola can be defined in terms of a quadratic function. If it can't
be defined in terms of a quadratic function it's not a parabola.
- Note in the second figure that this parabola contains all the points shown
in the original graph.
Basic
Quantities (two points and asymptote) of the Basic Exponential Function y = 2^x
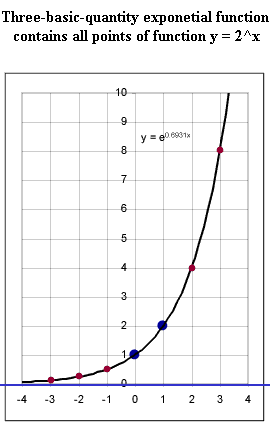
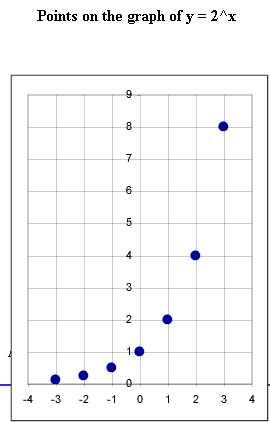
- The graph of y = 2^x passes through the points indicated in the first
graph, as you can easily verify by making table.
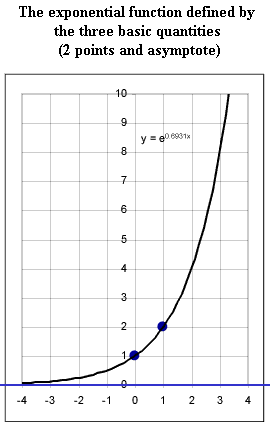
- The two basic points and the horizontal asymptote, which are the x = 0 and
x = 1 points and the x axis (y = 0), are shown in the second figure.
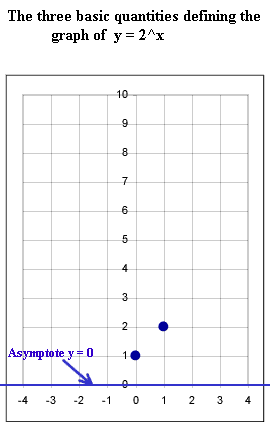
- The graph of y = 2^x is defined by these two basic points and the
asymptote. This graph doesn't have a specific name; it's just referred
to as the graph of an exponential function.
- Note in the second figure that the function as shown contains all the
points shown in the original graph.
