Precalculus II
Class Notes, 1/14/99
These notes are correlated with the Team Exercises from
1/12/99, which you already should have completed, and
the Class Exercise for today, 1/14/99. You should do
these exercises before reading the notes.
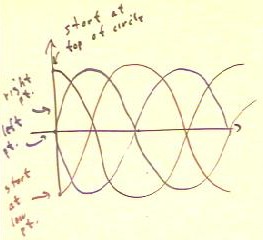
The graph we obtain starts out in a manner
that is related to the starting point on the circle. In all cases
we assume motion around the circle in a positive (counterclockwise)
direction.
- If we start at the rightmost point of the circle we obtain a
graph which starts from y = 0 and begins increasing,
as indicated below.
- If we start at the leftmost point of the circle we obtain a
graph which starts from y = 0 and begins decreasing,
as indicated below.
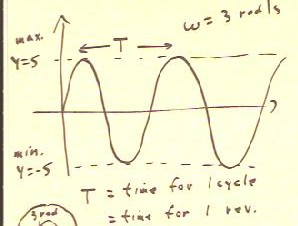
For motion on a circle of radius 5, at angular velocity `omega = 3 rad/sec, we
see that
- y ranges from -5 to 5
- the distance between the peaks corresponds to the time required to complete one
trip around the circle.
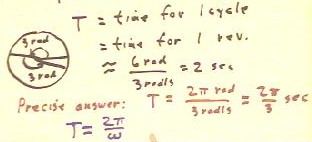
To complete 1 trip around the circle,
- We must move through an angular displacement of 2 `pi radians, or approximately 6
radians.
- At 3 rad/sec we would complete 6 radians in 2 sec.
- 2`pi is a little greater than 6, so the time required is a little over 2 seconds.
- The actual time is 2 `pi rad / (3 rad/sec) = 2 `pi / 3 seconds.
- Note that we obtained the period T by dividing the 2 `pi radians of the circle by
the angular velocity 3 rad/sec; we therefore get period by dividing 2 `pi by angular
velocity `omega, so T = 2 `pi / `omega.
We see from the circle that we cover 3 radians each second, requiring a little
more than 2 seconds to complete a cycle.
Recall that the period is T = 2 `pi / `omega.
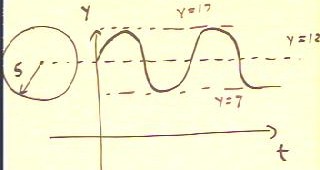
If we locate a circle of radius 5 at the altitude
y = 12, we obtain a cyclical graph whose y coordinate ranges
from y = 7 to y = 17, as shown below.
We note the following:
- The center of the circle at y = 12 is halfway
between the extreme values y = 7 and y = 17.
- The radius of the circle is half of the difference 17
- 7 = 10 between the extreme values y = 7 and y = 17.
- The angular velocity of the point on the circle, and hence the peak-to-peak
distance, could at this stage be anything at all. We can
therefore adjust the peak-to-peak distance by adjusting
the angular velocity of the point on the circle.
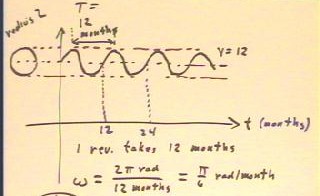
To model the length of full daylight in hours vs. clock time in
months, where day length ranges from 10 hours to 14 hours,
we first locate the circle in the appropriate vertical position and
determine its radius:
- We locate the center of the circle halfway between the
extreme y values 10 and 14, or at y = 12.
- We use a circle radius of 2, which is half the difference between
the extreme values y = 10 and y = 14 (the difference is 4; half this
difference is the radius 2).
To determine the angular frequency `omega of the motion around the
circle:
- We note that it takes 12 months to complete one cycle.
It will therefore require the reference point 12 months to complete its
path around the circle.
- To complete the 2 `pi radians of the path around the circle in 12
months requires that the reference point move at an angular velocity of
`omega = 2 `pi rad / 12 months = `pi / 6 rad / month.
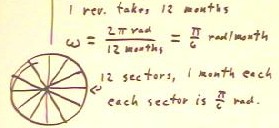
We note that the circle divides symmetrically into 12 equal sectors,
each with an angular measure of `pi / 6 radians and each corresponding to
one month of motion. Thus the angular velocity is easily
seen to the `pi / 6 rad / month.
Class Exercise: Modeling
Periodic Phenomena with Graphs based on Circles
The goals of this exercise are to
- understand the effect of the angular velocity of the circular model on
the distance between peaks of the associated graphs
- understand the effects of the radius of the circle and the y
coordinate of its center on the graph of the
circular model
- for a given situation involving cyclical changes, understand how to position
a circle, determine its radius and determine the angular
velocity of the appropriate model, and construct the associated
graph
- determine the effect the starting position on the circle has on the graph.
Begin by sketching a graph of the y coordinate of a
point moving around a circle at 3 rad/s vs. clock time t.
- How far is it between the peaks of the graph?
- Explain why, if we assume that the center of the circle lies on
the x axis, the graph should be symmetric with respect to the x
axis.
- Assuming that the center of the circle lies on the x axis,
and that the circle has radius 5, then what is the maximum and
what is the minimum y coordinate of a point on the graph?
- Sketch the corresponding graph.
- Explain why, if we assume that the center of the circle lies on the
line y = 12, the graph should be symmetric about the line
y = 12.
- Assuming that the center of the circle lies on the line y = 12 and that the circle has
radius 5, the what is the maximum and what is the minimum coordinate
of a point on the graph?
Where would you position the circle, and what would be its radius,
if you wished to model a quantity y which varies cyclically from
a value of 6 to a value of 14?
- Given the values between which a cyclical quantity varies, how you
determine where to position the circle that models the quantity, and how
the determine the radius of the circle?
At a certain latitude near here the length of a day varies from
approximately 9 hours to approximately 15 hours over a period
of 1 year, or 12 months.
- How could you position a circle so as to obtain a graph to
model y = length of a day in hours vs. t = clock
time in months?
- What angular velocity should you give the point moving
around the circle?
- Sketch and label the corresponding graph.
The average daily mean temperature in this vicinity varies from an
approximate maximum of 75 degrees Fahrenheit to an
approximate minimum of 35 degrees Fahrenheit over a 52
week period.
- How could you position a circle so as to obtain a graph to
model y = average daily mean temperature vs. t = clock
time in weeks?
- What angular velocity should you give the point moving
around the circle?
- Sketch and label the corresponding graph.
As the tide rolls in and out the water level varies from 12
feet below a certain walkway to 2 feet above, over a 10-hour
period.
- How could you position a circle so as to obtain a graph to model
y = water level vs. t = clock time in hours?
- What angular velocity should you give the point moving
around the circle?
- Sketch and label the corresponding graph.
As the waves roll into the shore of the ocean at a certain place, a buoy bobs up and
down from a point 40 feet above the ocean floor to a point 36
feet above the ocean floor, completing a full up and down cycle 5 times
every minute.
- How could you position a circle so as obtain a graph to model y
= buoy height above ocean floor vs. t = clock
time in seconds?
- What angular velocity should you give the point moving
around the circle?
- Sketch and label the corresponding graph.
