The data below were taken by a student.
rb length (cm) |
rb stretch (cm) |
force (N) |
9.7 |
0.9 |
0.67 |
10 |
1.2 |
0.94 |
10.5 |
1.7 |
1.3 |
11 |
2.2 |
1.5 |
11.5 |
2.7 |
1.6 |
12 |
3.2 |
1.8 |
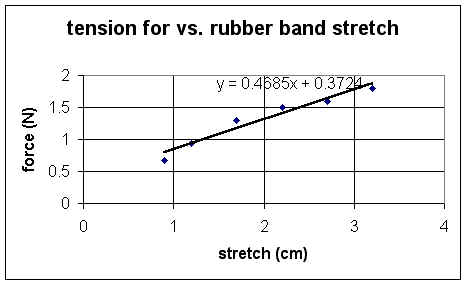
The force vs. stretch graph is shown below:
The attached Excel file Exp 10 depicts the graph (exp 10 version5 for Version 5, which should work on older versions of Excel). I've added a trendline to show the deviation from linearity.
The next table depicts the calculation of force * distance products and totals. This will be relevant in Experiment 15.
rb length (cm) |
rb stretch (cm) |
force (N) |
ave force (N) |
dist on interval (cm) |
ave force * dist (N cm) |
total f * `ds (N cm) |
8.8 |
0 |
0 |
||||
9.7 |
0.9 |
0.67 |
0.335 |
0.9 |
0.3015 |
0.3015 |
10 |
1.2 |
0.94 |
0.805 |
0.3 |
0.2415 |
0.543 |
10.5 |
1.7 |
1.3 |
1.12 |
0.5 |
0.56 |
1.103 |
11 |
2.2 |
1.5 |
1.4 |
0.5 |
0.7 |
1.803 |
11.5 |
2.7 |
1.6 |
1.55 |
0.5 |
0.775 |
2.578 |
12 |
3.2 |
1.8 |
1.7 |
0.5 |
0.85 |
3.428 |
These calculations are easy to set up in Excel if you know how to use the Fill Handle
If you don't know how to use the Fill Handle, then you might have to key in the calculations one at a time. However the amount data isn't that great and it woun't take too long to do so.
(On Experiment 15 you might find that you need to use the heavy rubber bands, or you might find that a few of the medium rubber bands work fine. If you use the medium rubber bands, your second set of data should give you the information you need.)
What is the difference between pendulum length, pendulum position, pendulum displacement, rubber band length and rubber band stretch?
As used in the experiment, these terms have the following meanings:
When doing the calibrate program I get confused on what information to put in when it asks for instrument reading and measured quantity. And then it asks to multiply by a constant factor. Could you please help me figure this out?
For example on the rubber band calibration: