class 050909
Submitting Questions
You need to ask at least one complete question for each class. To ask a question you go to the Submit Work Form at http://www.vhcc.edu/dsmith/class_work_form.htm.
Enter your name and use your access code for your password. If you don't have an access code you need to email the isntructor from your VCCS email address requesting one.
Unless otherwise specified your assignment code will just be a short phrase describing the nature of the question. The phrase should not include any punctuation. For instance the phrase might be 'v vs t graph' or 'definition of acceleration' or 'force vs distance for rubber band'. Do not include any punctuation in the phrase, since that phrase will be used as the name of a file.
A question has the following characteristics:
Rubber Band Data Syntax:
For each stretch, put the 10 numbers in a column. If you did 6 stretches then the 1, 2, 3 N stretches, you will have a total of 9 consecutive columns. Columns run down the page. The 1, 2, 3 N columns should have '1 N', '2 N' and '3 N' above the top of the columns.
If you have been asked to redo your rubber band data, please put it into this form and resend.
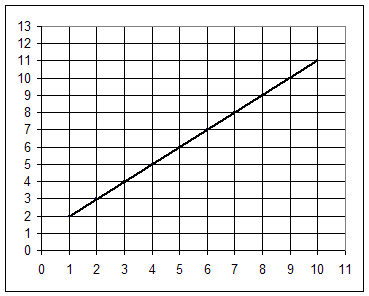
Graph 1:

Suppose Graph 3 depicts velocity in cm/s vs. position in cm. What then does the area represent, and what does the slope represent? What are the units of area and slope?
If this is a graph of velocity in cm / sec multiplied by clock time in seconds then:
Rise of 9 represents the change in the vertical coordinate. The vertical coordinate is velocity in cm / sec. So rise represents change in velocity in cm / s.
Run of 9 represents the change in the horizontal coordinate. The horizontal coordinate clock time in seconds. So run represents change in clock time is sec.
Average altitude represents the average value of the vertical coordinate of the graph. The vertical coordinate of the graph represents the velocity in cm / s. So the average altitude represents the average velocity in cm / s. For this example therefore ave. velocity is 6.5 cm/s.
The midpoint altitude represents the vertical coordinate at the midpoint of the graph. The vertical coordinate represents the velocity in cm / sec, so the midpoint altitude represents the velocity at the midpoint clock time. The graph is a straight line so the midpoint velocity is the same as the average velocity. Midpt velocity here is 6.5 cm/s.
The slope of the graph is rise / run. For this graph rise represents change in velocity, run represents change in clock time, so slope represents change in velocity / change in clock time. This is the average rate of change of velocity with respect to clock time, or acceleration. Acceleration here is 9 cm/s / (9 sec) = 1 cm / s^2.
The area of the graph is ave alt * width. Ave alt represents ave vel, width represents change in clock time, so area represents ave vel * change in clock time = displacement. Displacement here is therefore 6.5 cm / s * 9 s = 58.5 cm.
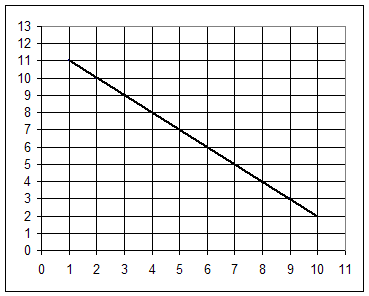
Graph 2:

Suppose Graph 2 depicts force in Newtons vs. position in cm. What then does the area represent, and what does the slope represent? What are the units of area and slope?
If this is a graph of force in Newtons multiplied by position in cm then:
Rise of -9 represents the change in the vertical coordinate. The vertical coordinate is force in Newtons. So rise represents change in force, in Newtons.
Run of 9 represents the change in the horizontal coordinate. The horizontal coordinate represents position in cm. So run represents change in position in cm.
Average altitude represents the average value of the vertical coordinate of the graph. The vertical coordinate of the graph represents the force in Newtons. So the average altitude represents the average force in Newtons. For this example therefore ave. force is 6.5 Newtons.
The midpoint altitude represents the vertical coordinate at the midpoint of the graph. The vertical coordinate represents the force in Newtons, so the midpoint altitude represents the force at the midpoint position. The graph is a straight line so the midpoint force is the same as the average force. Midpt force here is 6.5 Newtons.
The slope of the graph is rise / run. For this graph rise represents change in force, run represents change in position, so slope represents change in force / change in position. This is the average rate of change of force with respect to position (we're gonna call this the force constant). The force constant here is -9 Newtons / (9 cm) = -1 Newton / cm.
The area of the graph is ave alt * width. Ave alt represents ave force, width represents change in position, so area represents ave force * change in position = work. Work here is therefore 6.5 Newtons * 9 cm = 58.5 Newton cm.
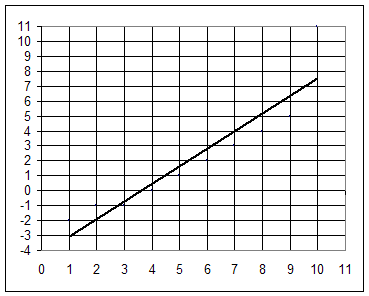
Graph 3:

Suppose Graph 3 depicts velocity in cm/s vs. position in cm. What then does the area represent, and what does the slope represent? What are the units of area and slope?
If this is a graph of velocity in cm / sec multiplied by clock time in seconds then:
Rise of 10.4 represents the change in the vertical coordinate. The vertical coordinate is velocity in cm / sec. So rise represents change in velocity in cm / s.
Run of 9 represents the change in the horizontal coordinate. The horizontal coordinate clock time in seconds. So run represents change in clock time is sec.
Average altitude represents the average value of the vertical coordinate of the graph. The vertical coordinate of the graph represents the velocity in cm / s. So the average altitude represents the average velocity in cm / s. For this example therefore ave. velocity is 2.2 cm/s.
The midpoint altitude represents the vertical coordinate at the midpoint of the graph. The vertical coordinate represents the velocity in cm / sec, so the midpoint altitude represents the velocity at the midpoint clock time. The graph is a straight line so the midpoint velocity is the same as the average velocity. Midpt velocity here is 2.2 cm/s.
The slope of the graph is rise / run. For this graph rise represents change in velocity, run represents change in clock time, so slope represents change in velocity / change in clock time. This is the average rate of change of velocity with respect to clock time, or acceleration. Acceleration here is 10.4 cm/s / (9 sec) = 1.16 cm / s^2.
The area of the graph is ave alt * width. Ave alt represents ave vel, width represents change in clock time, so area represents ave vel * change in clock time = displacement. Displacement here is therefore 2.2 cm / s * 9 s = 19.8 cm.
Rubber Band Force * Distance Preliminary Experiment
Projectile behavior
Sliding behavior
Same thing, but measure sliding distance along tabletop. No rollin', minimal rotatin', get rid of or manage to miss obstacles on the tabletop. That is:
Measure force vs. pullback for your rubber band system. Get at least 4 readings over the range of your pullbacks.
Estimate as accurately as possible the force of every pullback you used.
Sketch a rough graph of force vs. position for each trial. The graph will look a lot like Graph #1 or Graph #2, but will probably start or end on the horizontal axis.
Find the area beneath each graph.
Make a table of area beneath graph vs. projectile distance.
Make a table of area beneath graph vs. sliding distance.
Text homework:
Phy 121: Chapter 1 exercises 1-4, 12-15, 24.
Phy 201: Chapter 1 exercises 3,6,9,12,15,18,21,24,27,30,33
(231 how much difference would a millisecond make?)