Class Notes Physics I, 8/28/98
Position and acceleration inferred from constant-acceleration velocity
vs. clock time graph
Problem
Graphical Solution
Slope and Area
of Velocity vs. Clock Time Trapezoid
Here we again, as in the preceding class, reason out a variety of
questions regarding the changes in position that can be inferred from velocity vs. clock
time information. We do this now within the context of known initial and final
velocities and time duration, assuming some unknown constant rate of velocity change.
We first reason out the solution, then we solve the problem graphically. We
again consider position changes over a number of relatively short time intervals, and
construct a position vs. clock time table and graph.
Today we
- determine total distance, average acceleration, velocities and positions at different
vlock times for an object whose velocity increases at a constant rate from one known
velocity to another during a given time interval
- represent the solution graphically in terms of velocity vs. clock time trapezoids
- generalize how a velocity vs. clock time trapezoid represents both displacement and
acceleration
Our starting example gives us the initial velocity, time duration and final velocity of
an object which changes velocity at a constant rate. This example leads to the
following questions:
Given the initial
velocity, final velocity and time duration of a uniformly accelerating object, how do we
reason out the corresponding acceleration and change in the position of an object?
In terms of the meanings of
altitudes, area, slope and width, how does a velocity vs. clock time trapezoid represent
change in position and acceleration?
Problem
Problem: The velocity of an
object increases at constant rate from 2 m per second to 6 m per second over time interval
from t = 0 to t = 10 seconds. We wish to determine
- the total distance moved during the 10 seconds,
- the average acceleration,
- the velocity at clock times t = 2, 4, 6 and 8 seconds, and
- the displacement from the initial position at each of these
clock times.
We first begin to reason out the results.
- To find the total displacement during the 10 seconds, we multiply the average
velocity by the time interval.
- To find the average velocity we note that if the velocity increases
from 2 m per second to 6 m per second, then if the velocity increases at a
constant rate the average velocity will be the average of the initial and
final velocities, in this case vAve = (2 m/s + 6 m/s) / 2 = 4 m/s.
- Multiplying this by the 10 second time interval, we obtain the total
displacement `ds = 4 m/s * 10 s = 40 m.
To find the average acceleration, we divide the change in
velocity by the time interval.
- The velocity change is (6 m/s - 2 m/s) = 4 m/s. The average
acceleration is the average rate at which velocity changes, or 4
m/s / (10 s) = .4 m/s/s.
To find the velocities at two-second intervals
- We note that the average rate which velocity changes is the acceleration
.4 m/s/s, which means a velocity change of .4 m/s every second.
- This implies a velocity change of .8 m/s during any two-second time interval.
- Starting with velocity 2 m per second at clock time t = 0, we see that the velocity
increases to 2.8 m/s at t = 2 sec, to 3.6 m/s at t = 4 sec, then to 4.4 m/s and 5.2 m/s at
t = 6 and 8 sec.
We can find the displacement over any time interval if we multiply the
average velocity over that interval by the duration of
the interval.
- Over the interval from 0 to 2 seconds, the velocity increased from 2.0 to 2.8 m/s, so
that the average velocity is 2.4 m per second.
- At an average velocity of 2.4 m per second, in 2 seconds the object will move (2.4 m/s)
* 2 sec = 4.8 meters.
Average velocities and displacements over the remaining four intervals
are 3.2 m/s and 6.4 meters, 4.0 m/s and 8.0 meters, 4.8 m/s and 9.6 meters, and finally
5.6 m/s and 11.2 meters.
The total displacement at each clock time is obtained by adding the
displacements for all the intervals prior to this clock time.
- For example the total displacement
up to clock time t = 6 sec is the sum `ds = 4.8 m + 6.4 m + 8.0 m = 19.2 meters of the
displacements over the first three-time intervals.
These calculations are summarized below.

Graphical Solution
The desired quantities can also be found by graphical means.
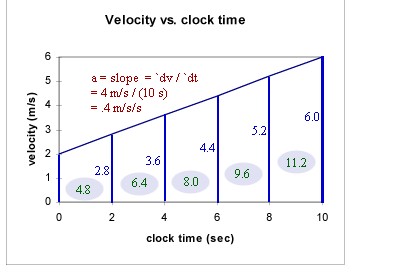
- The graph below depicts the velocity as it rises from 2 m per second to 6 m per second
between clock times t = 0 sec and t = 10 sec.
- Acceleration is the slope: rise / run =
`dv / `dt = 4 m/s / (10 s) = .4 m/s/s.
The velocities at the intermediate times 2, 4, 6, 8, 10 seconds are
indicated by vertical lines, with velocity labeled to the left of
each line.
The average velocity for each interval is the height of
the graph at the midpoint that interval.
- Multiplying the midpoint
altitude for each trapezoid (the average velocity) by the 2-second width of
the trapezoid we obtain the areas 4.8 m, 6.4 m, 8.0 m, 9.6 m and 11.2 m.
- These areas correspond
to the product of average velocity and time duration,
hence to the displacement during the time interval.

http://youtu.be/IHT2YlutZL8
http://youtu.be/_AaGoFJMy1U
http://youtu.be/rdyjcU6-uD0
http://youtu.be/s4Q-awKu2EY
http://youtu.be/hGJQpRV6TQQ
Slope and Area of
Velocity vs. Clock Time Trapezoid
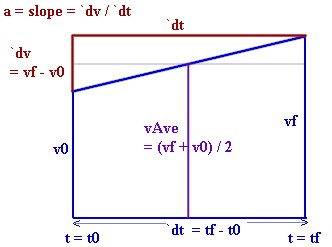
In general we can model the constant-rate increase in velocity from v
= v0 to v = vf, with clock time running from t = t0 to t = tf, by the blue trapezoid shown
below.
- It is understood that the vertical direction represents velocity
while the horizontal direction represents clock time.
- The red triangle represents or means of calculating the slope, with the
rise representing the velocity change `dv = vf - v0 and
the run representing the time duration `dt = tf - t0.
- The slope rise/run = `dv / `dt thus represents the time rate of
change of the velocity, also called the acceleration (the speed
of the speedometer needle).
- The vertical purple line halfway between the left and the right altitudes represents the
average of the initial and final velocities, which for constant
acceleration situation is the average velocity.
- If we multiply this average altitude by the width of
the trapezoid, we're multiplying the average velocity by the time
duration, and we obtain the displacement during the time
interval.
- The faint purple line across the mid-top of the graph defines a rectangle whose altitude
is equal to the average velocity, and whose area is therefore equal to
the product of average velocity and time duration, and
thus to the displacement during time interval.

http://youtu.be/mBviyN74Igk

