"
Physics II
Class Notes, 1/13/99
Analyzing Experiment 4
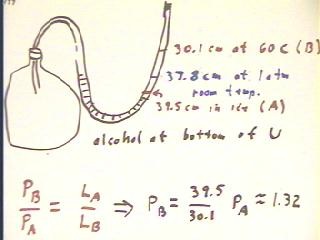
The figure below depicts the gas thermometer used in the experiment.
- When the air in the bottle is heated, the pressure in
the bottle increases.
- The pressure in the tube on the bottle side of
the alcohol increases along with the pressure in the bottle.
- The alcohol column therefore pushes on the air
column in the sealed end of the tube.
- This push compresses the air in the column, so that the air in the
column is very nearly at the same pressure as that in the bottle.
- There is a difference in the pressure in the air
column and in the bottle, due to the different levels of
the alcohol on the two sides of the U.
- This pressure difference is approximately 1 atmosphere per
15 meters of altitude difference.
In class one group observed air column length of 39.5 cm, 37.8 cm and 30.1 cm at
temperatures of 0 C, 24 C and 60 C.
- Accepting the fact that the ratio of pressures is equal to the inverse
ratio of column lengths, we conclude that the air column
pressure in state B (60 C) is 1.32 that of the
pressure in state A (0 C).
- The difference in the levels of the alcohol
column changes between state A and state B by double the change
in column length (one side goes down while the other goes up),
or by approximately 19 cm. This results in a pressure difference of
approximately 19 / 1500 atm, or .01 atm between the two sides of
the alcohol column.
- This pressure difference might or might not be significant with
the apparatus we are using.
- A plot of bottle pressure vs. temperature should be linear;
since pressure is inversely proportional to column length a
plot of 1 / L vs. temperature should be linear. You
should check this out.
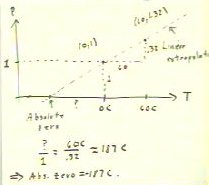
Estimating absolute zero
Ignoring the pressure differences due to the different heights
of the alcohol column, we plot two points on
the pressure vs. temperature graph, corresponding to the
extreme temperatures observed. We then extrapolate from
our two points, assuming a linear pressure vs. temperature relationship,
to determine the temperature at which we expect pressure to
be zero.
- The temperature at which pressure reaches 0, for an ideal gas,
is called absolute zero.
- The present experiment uses air rather than an ideal gas,
though the inaccuracies inherent in the apparatus used here are much greater
than those incurred by using air rather than an ideal
gas.
- It doesn't matter what pressure units we use. The zero of
pressure will occur at the same temperature whether we
measure pressure in atm, Newtons/m^2, psi,
or any other consistent unit.
- We therefore use as our unit of pressure whatever the pressure was
in the air column at zero Celsius.
- Since the pressure ratio is 1.32, the pressure
at 60 C will be 1.32 * 1 = 1.32.
- Thus our graph points are (0 C , 1) and (60 C,
1.32).
- We extrapolate easily enough, using similar triangles.
- Our result is an estimate of - 187 C for absolute
zero. The accepted value is - 273 Celsius.
The group whose data we used did not carefully 'zero' the
apparatus at room temperature between readings. One group who did obtained a temperature within
10 degrees of the accepted value of absolute zero. However, the expected
precision with this apparatus might be closer to +- 30 Celsius.
Nonlinearity of
many temperature measuing devices
The linear pressure vs. temperature relationships for
ideal gas give us an accurate way of defining a
linear temperature scale.
Gas thermometers are slow and relatively
expensive, so are not practical for a lot of important
applications.
The uncalibrated thermometer you used in the initial
experiment used an alcohol column to measure temperature.
- Alcohol does not expand in a perfectly linear fashion.
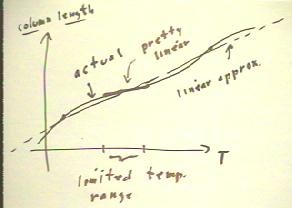
- The figure below depicts a hypothetical column length vs.
temperature curve for alcohol (this is not an actual depiction of the
correct curve for alcohol).
- We see that while the column length always increases with
temperature, the increase is not linear.
- An overall linear approximation, indicated by the dotted line in
the figure below, stays reasonably close to the curve.
- A thermometer marked in accordance with this linear
approximation might be accurate enough for many
applications, but for applications requiring precision the linear
approximation would not be appropriate.
- Over any limited temperature range the curve is approximately
linear.
- Such a limited temperature range
is depicted below.
- A thermometer calibrated by a good
linear approximation over this range would remain very close to
the accurate temperature.
As you will read in your text, other
properties used to measure temperature also have their nonlinearities,
analogous to those of the alcohol thermometer.

When we measured the temperature changes when a warm object of
known mass and temperature was placed into a known
mass of water at a known temperature, we
assumed that the thermal energy gained by the water was equal to that lost
by the rock.
Here we symbolize the process.
- We assume that the mass and temperature of the rock
are m2 and T2, while those of the water
are m1 and T1.
- We assume that the final temperature of the system consisting of the
water and the rock is Tf.
- The change in temperature of the water is `dT1
= Tf - T1, while that of the rock is `dT2 = Tf - T2.
We will symbolize our assumption of energy conservation in
terms of these variables.
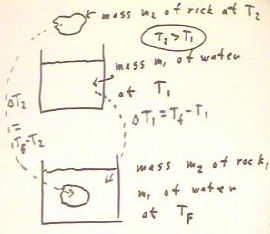
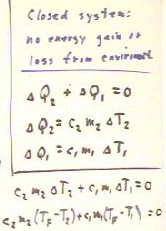
Assuming a closed system, with no energy gain or loss
from the system, we see that the changes `dQ1 and `dQ2 in
the thermal energies of the water and the rock must add up to
zero.
If we let c1 stand for the 4.19 Joules / (gram Celsius),
indicating the thermal energy required to raise one gram of
water by one Celsius degree, and let c2 stand for the analogous
quantity for the rock (i.e., c1 and c2 are the specific heats of
the water and the rock), we see that
- `dQ` = c1 m1 `dT1 and
- `dQ2 = c2 m2 `dT2.
Using these quantities we translate `dQ1 + `dQ2 into the equation in
the second line from the bottom of the figure below.
Since `dT1 = Tf - T1 and `dT2 = `TF - T2, we obtain the equation in the last
line of the figure below.
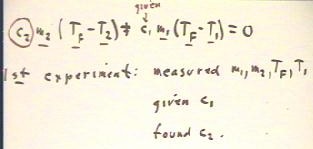
In our experiment, we were given the value of c1 and
we measured m1, m2, TF and T1.
Looking at the equation for energy conservation, we
see that the only quantity we do not know is c2.
- We can easily solve the equation for c2.
- This equation therefore summarizes the means we used to reason
out the specific heat c2 of the rock
- .
- You should attempt to relate the solution c2 = c1 m1
(Tf - T1) / [ m2 (T2 - Tf) ] of the equation to your reasoning process.
- What is the meaning of the numerator of
this expression?
- What is the meaning of the denominator?
- How did you use these two
quantities to reason out c2?
"
